Model-Data Comparison
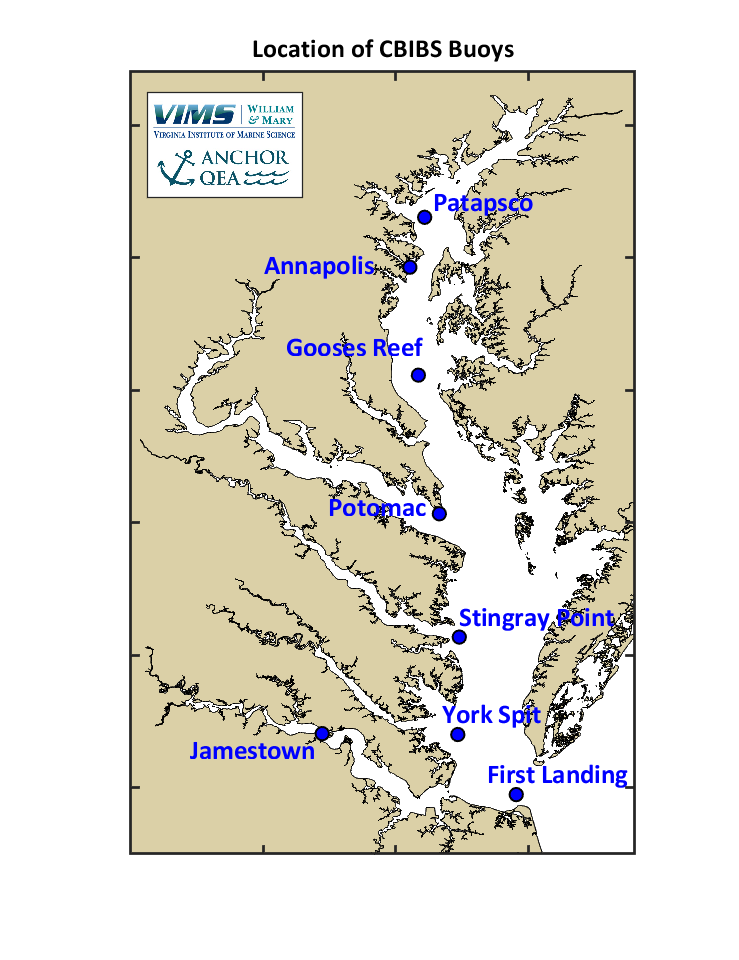
Observational data is available a various locations throughout the Chesapeake Bay. One set of observational data that is readily available nearly as soon as it is collected is from the Chesapeake Bay Interpretive Buoy System (CBIBS). CBIBS provides a range of real-time data, including near-surface salinity and water temperature. CBEFS automatically downloads the most recent salinity and water temperature data throughout the day and compares the modeled salinity and temperature to the observed values. Another data source is National Oceanic and Atmospheric Administration (NOAA) water level gauges. Additionally, NOAA has installed vertical arrays of sensors at six locations in the Bay that provide high-frequency data at multpile depths in the water column.
This model-to-data comparison webpage provides line-plots comparing the recent-past and forecast CBEFS near-surface salinity, water temperature, and water level (water surface elevation) to the observed data. These plots provide a general understanding of how the forecast relates to observed values at the same location. Basic statistics of the accuracy of CBEFS relative to the observed data are provided below the line plots. At times, these real-time data will be unavailable, so it is not guaranteed that CBIBS data will always be available on these line plots.
Real-time comparisons of forecast-to-observed waves are provided on the CBEFS waves webpage. Comparisons of CBEFS dissolved oxygen to Water Quality Monitoring Program data are provided on the dissolved oxygen line plots webpage. Comparisons of CBEFS salinity and temperature to Water Quality Monitoring Program data are provided on the Bay-wide Salinity and Bay-wide Temperature webpages.
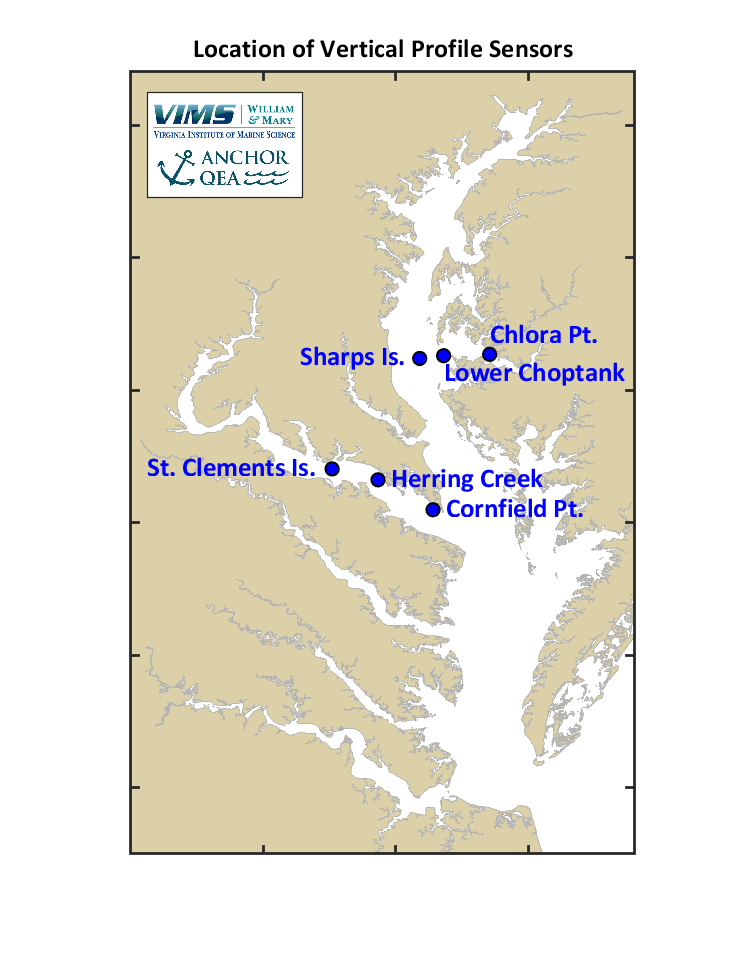
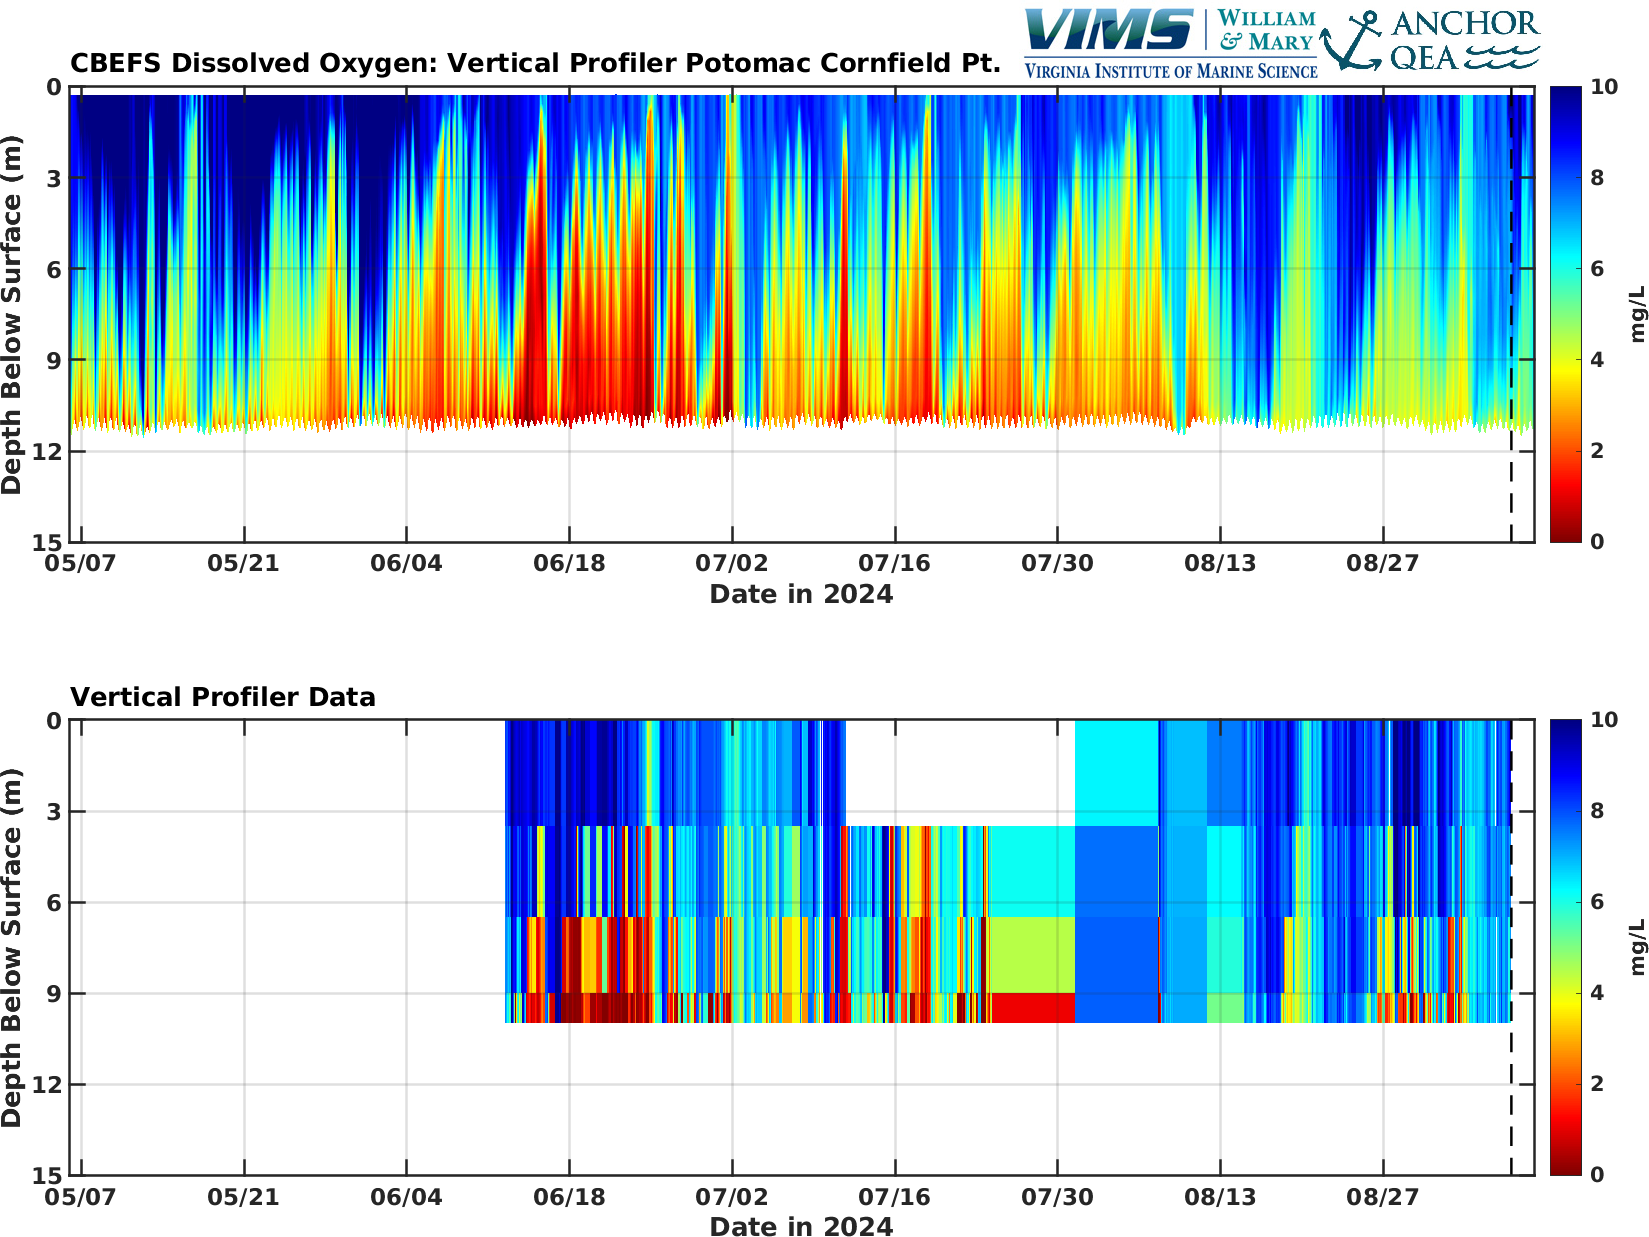
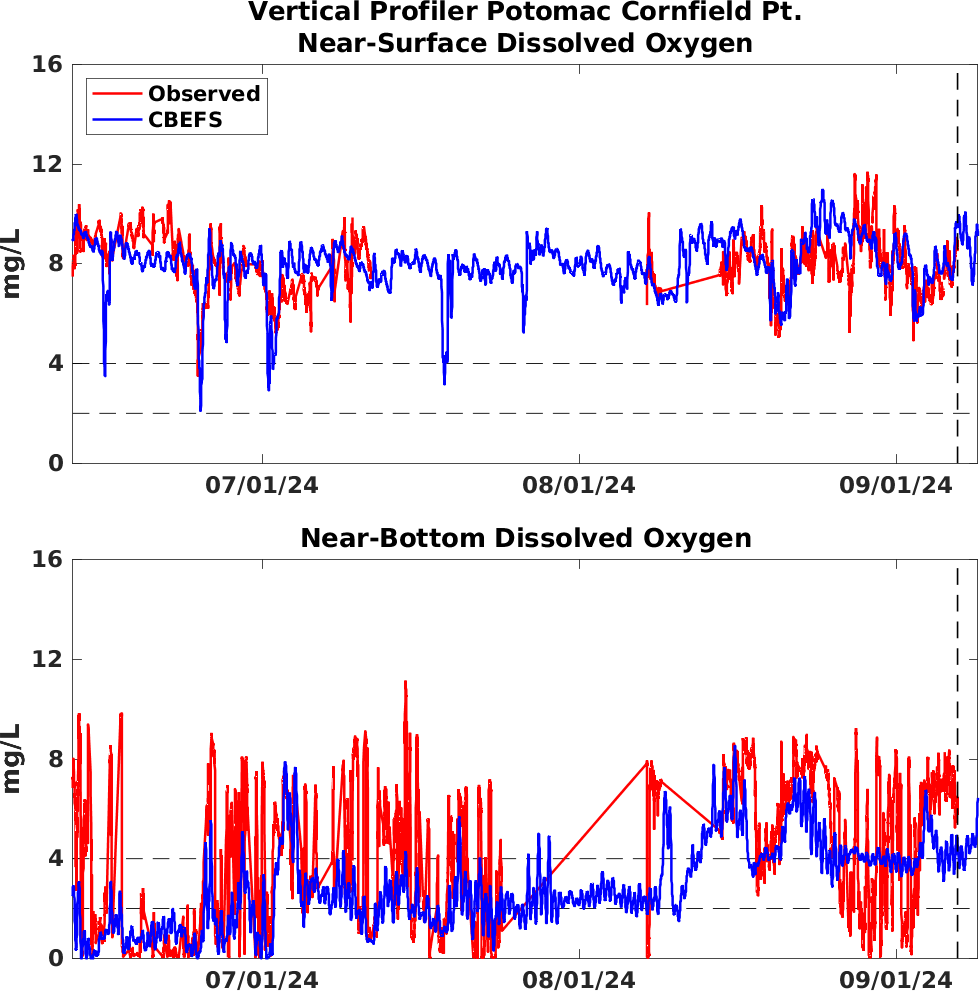
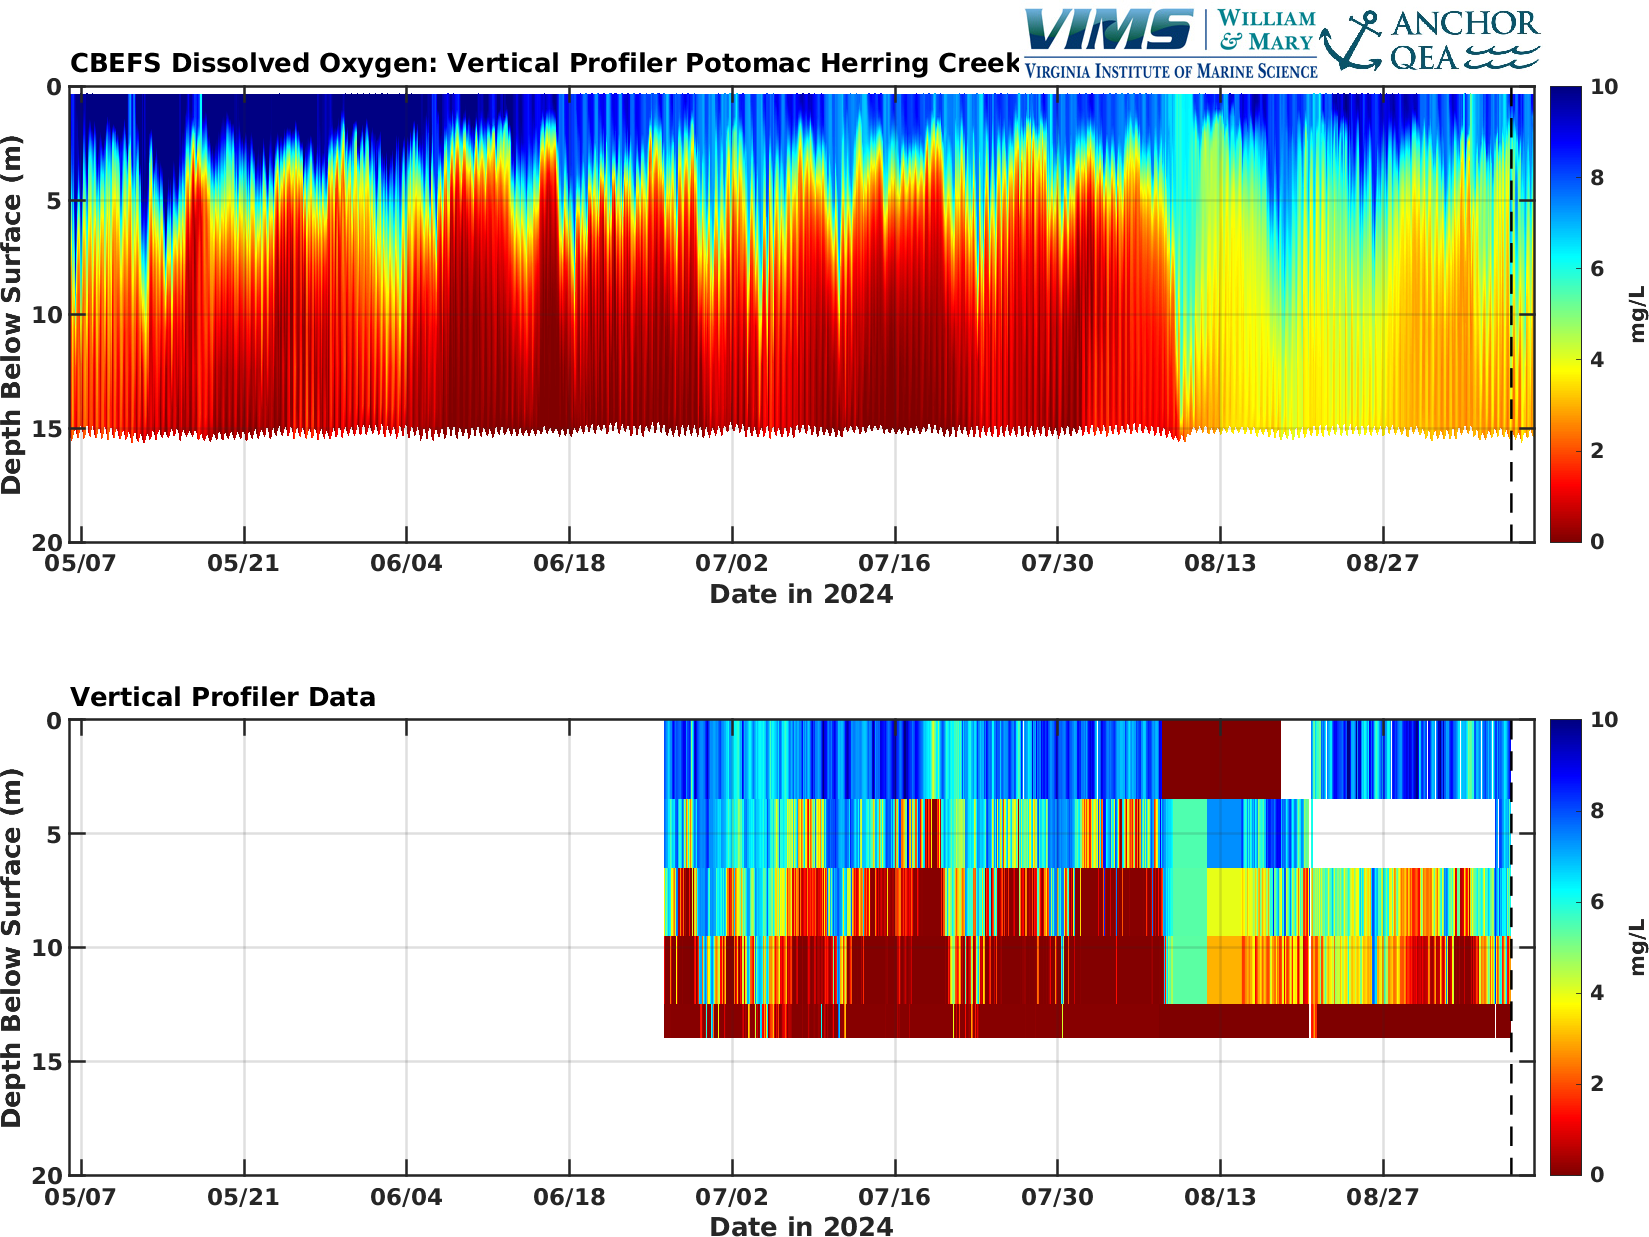
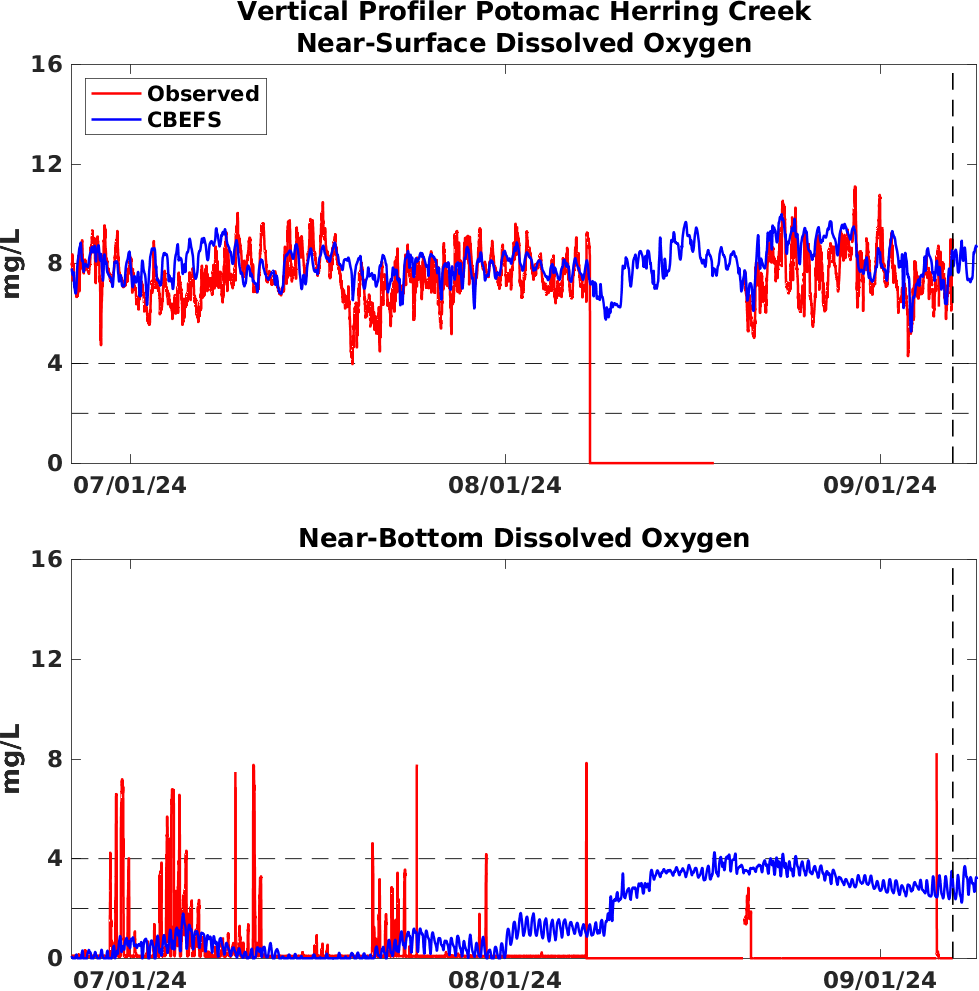
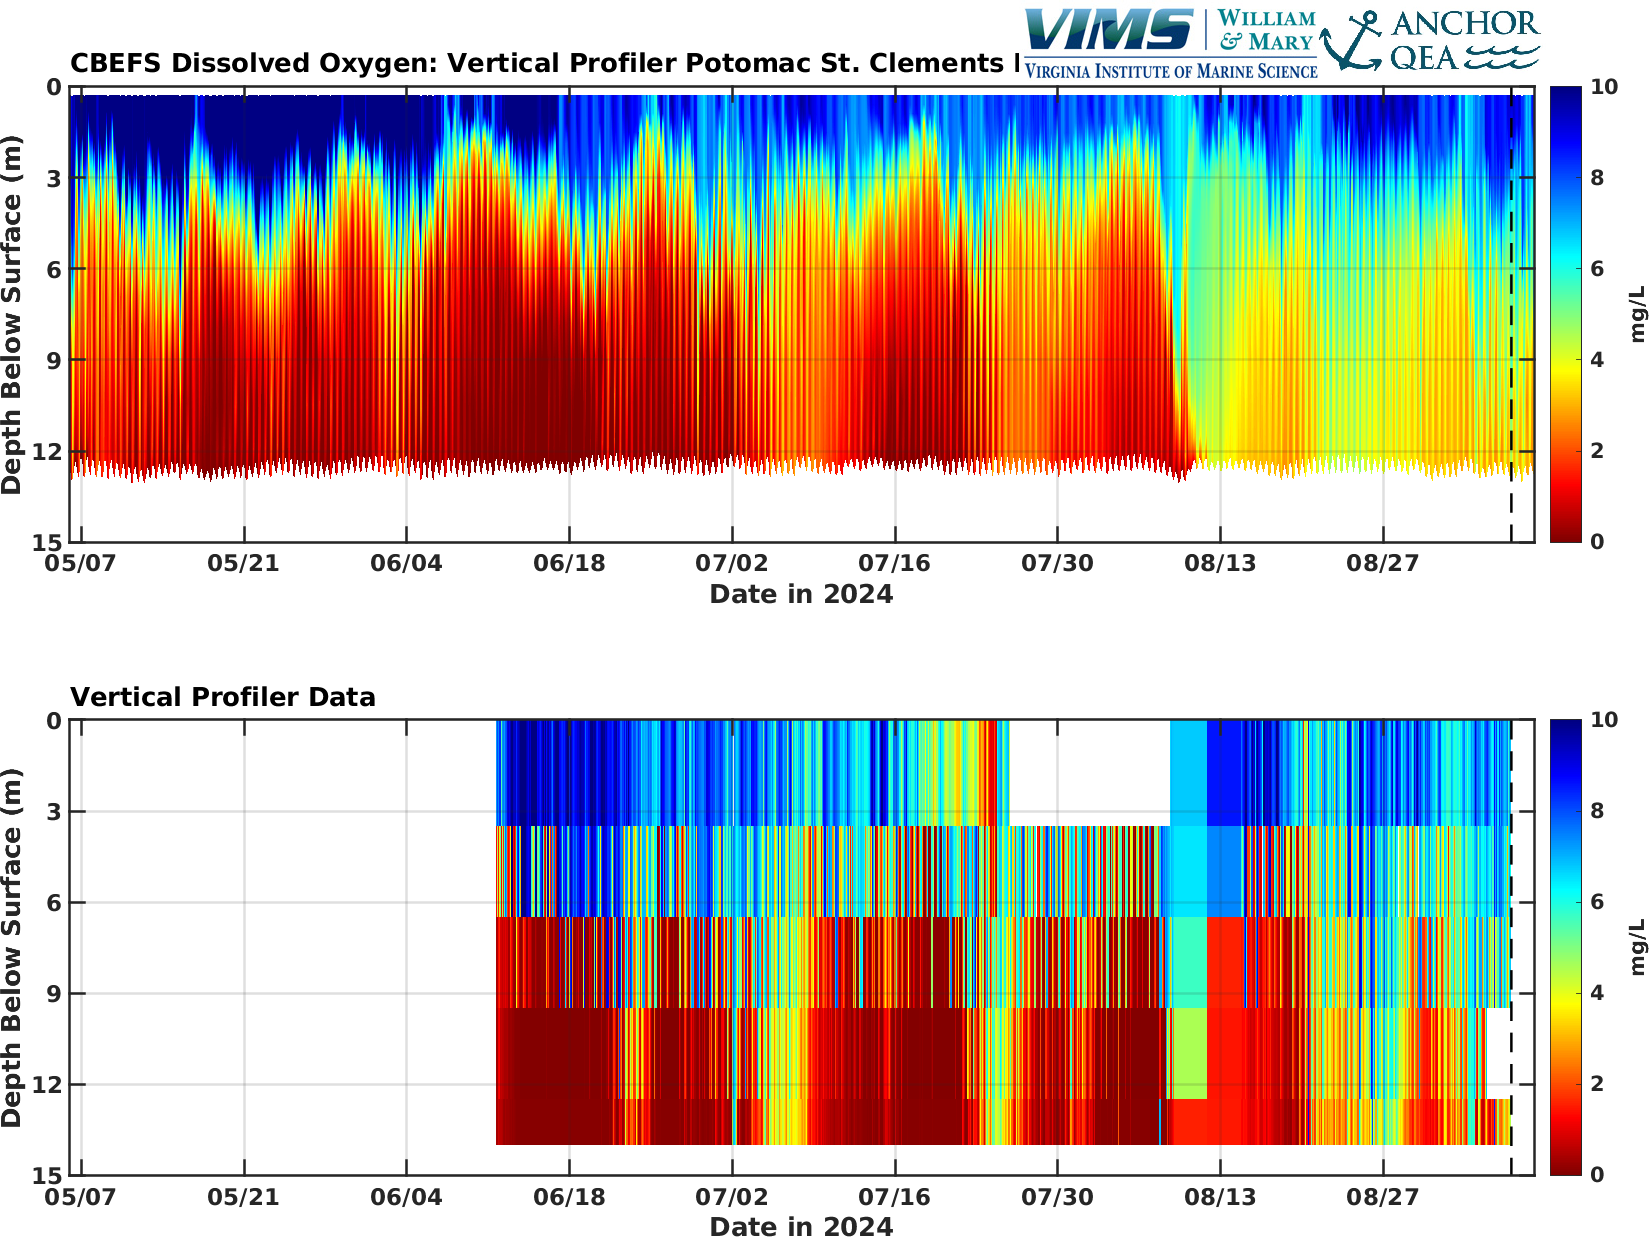
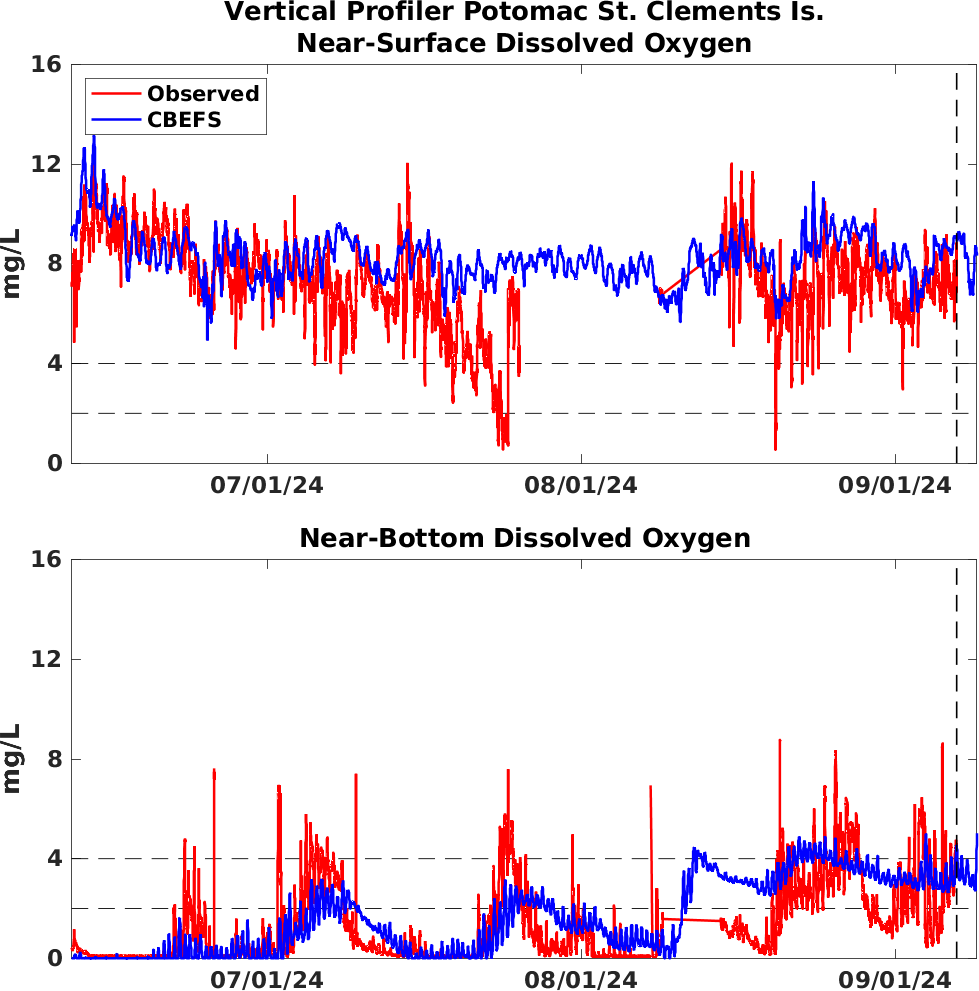
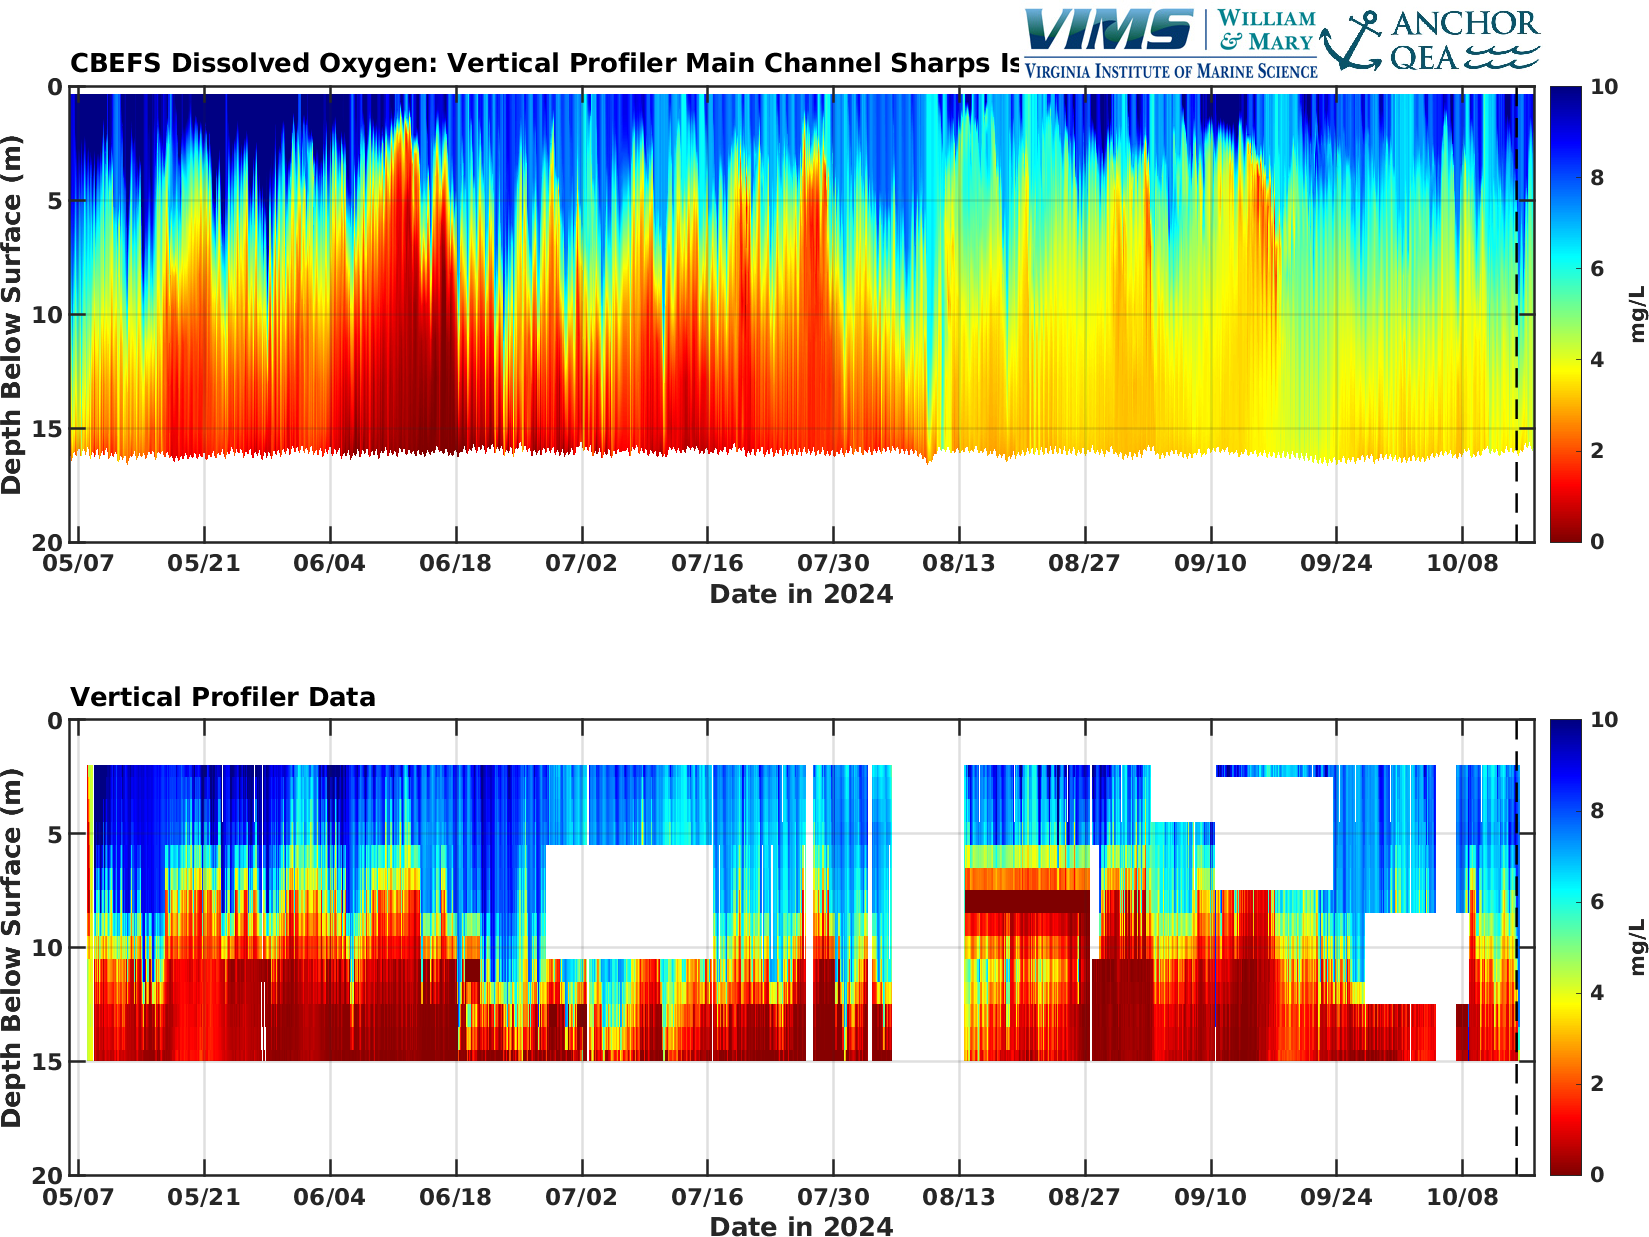
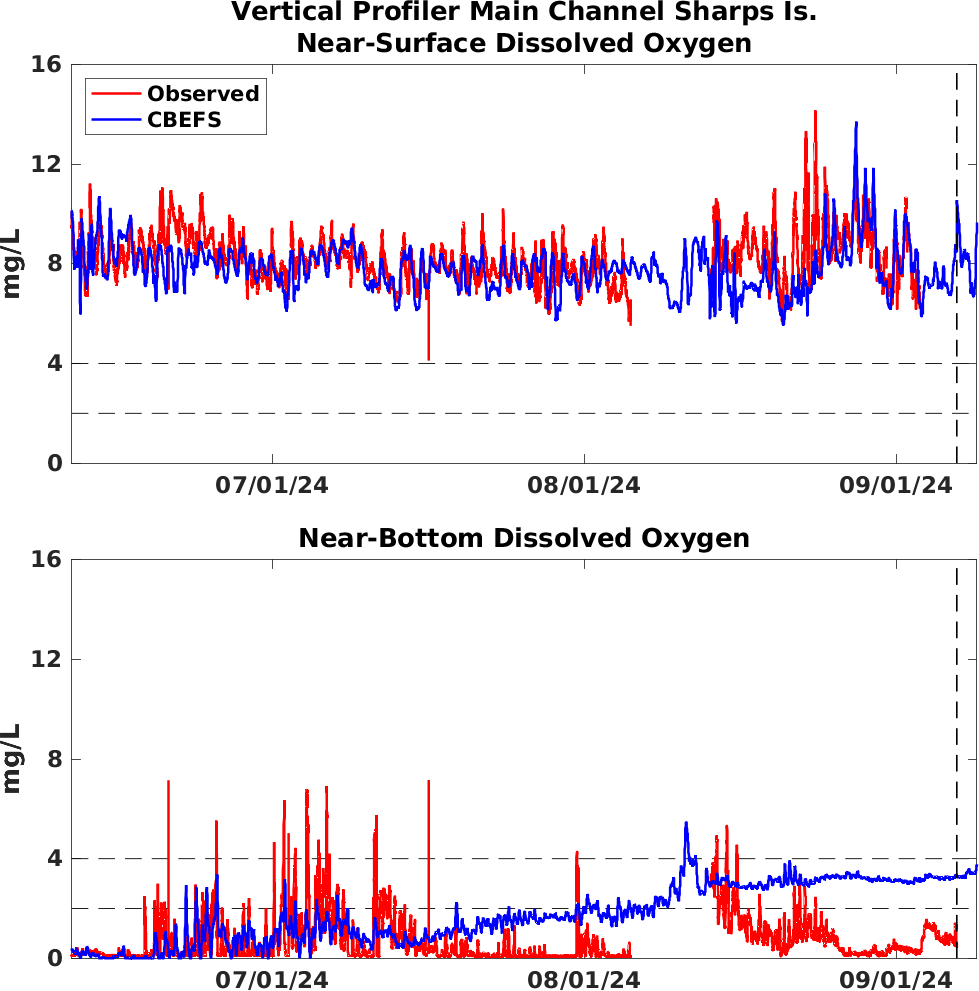
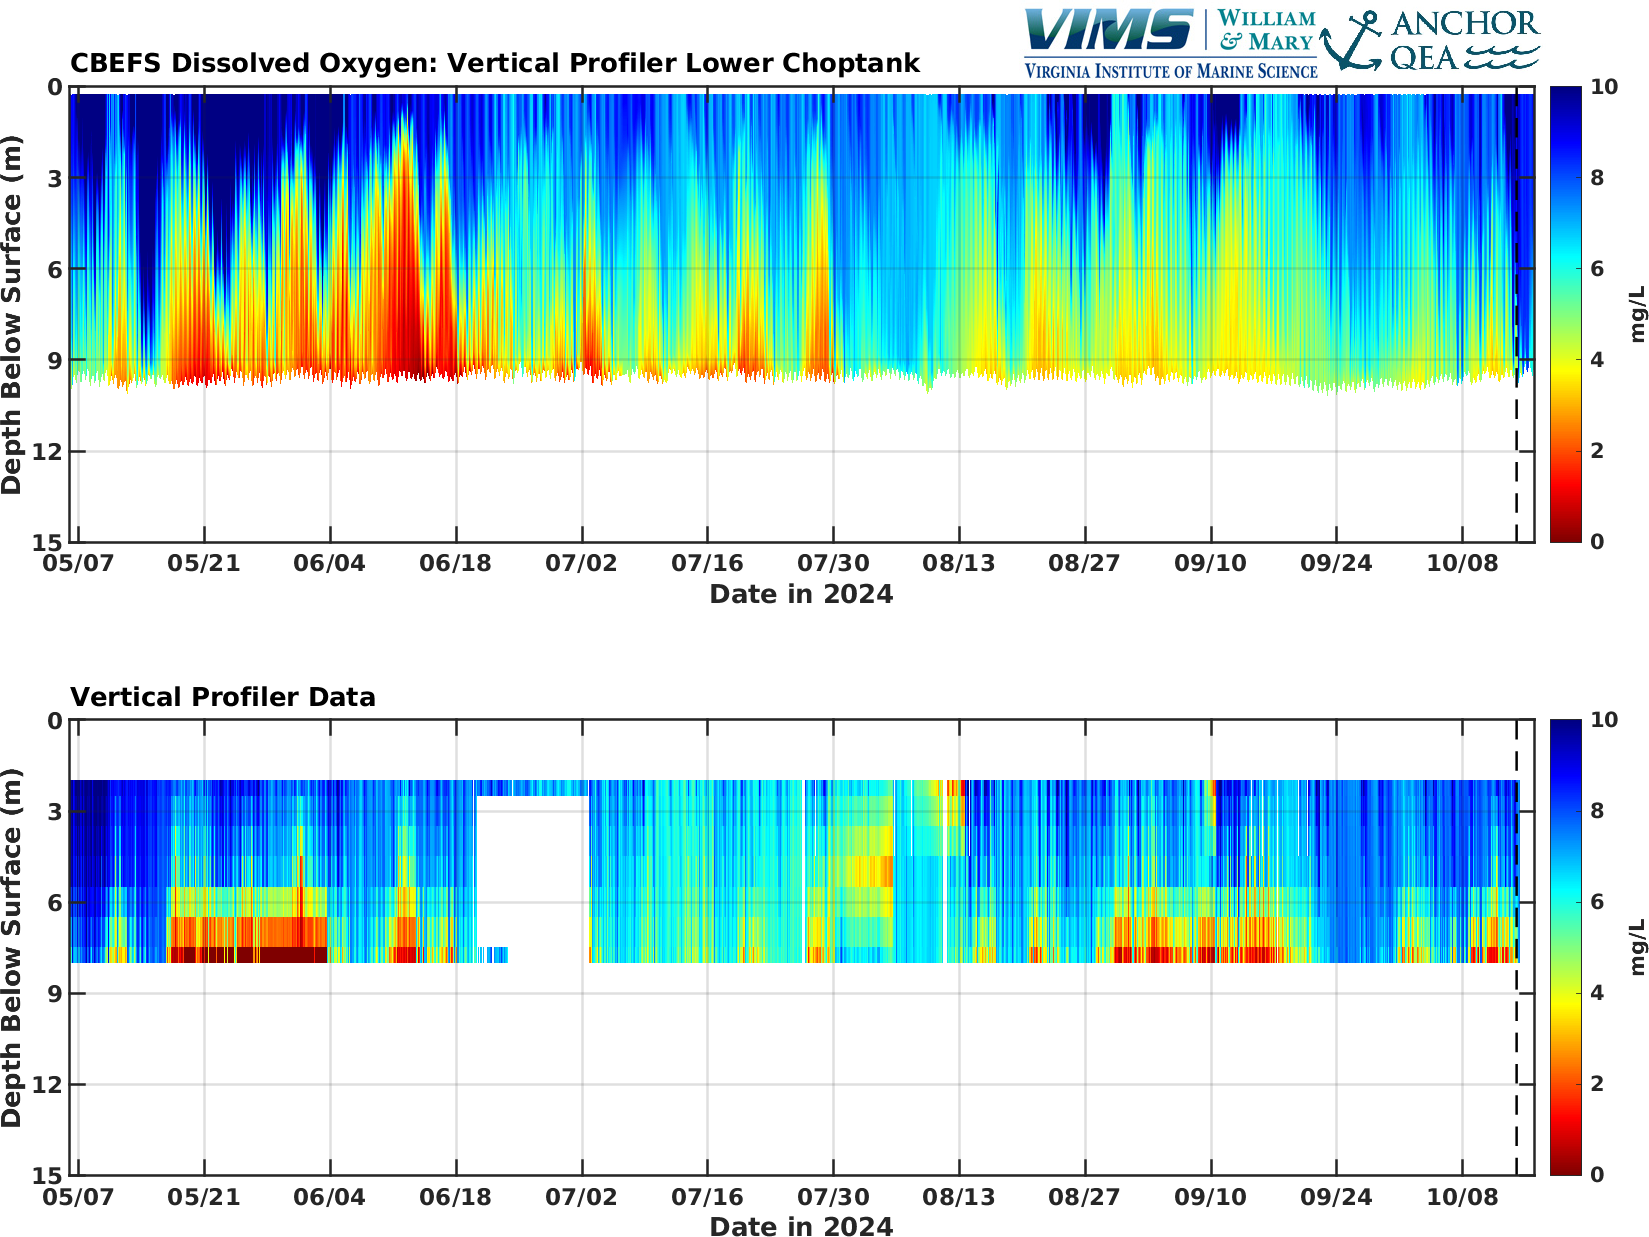
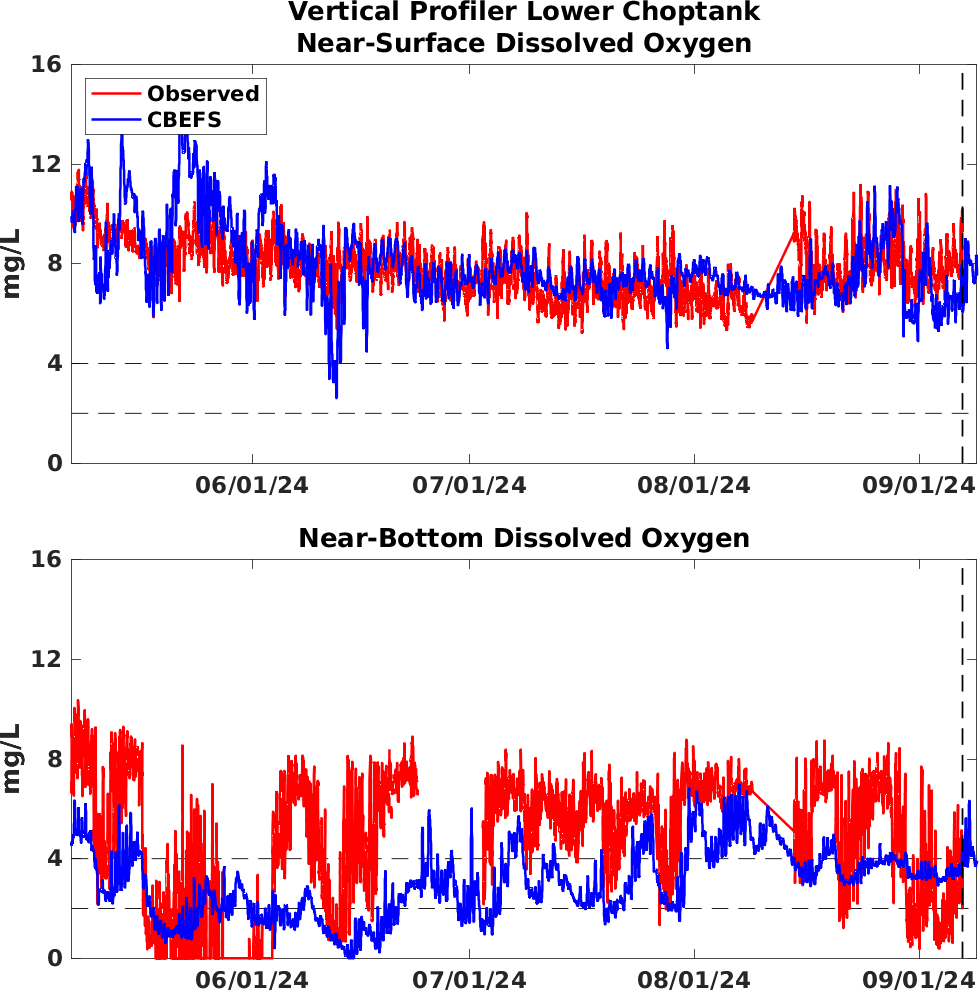
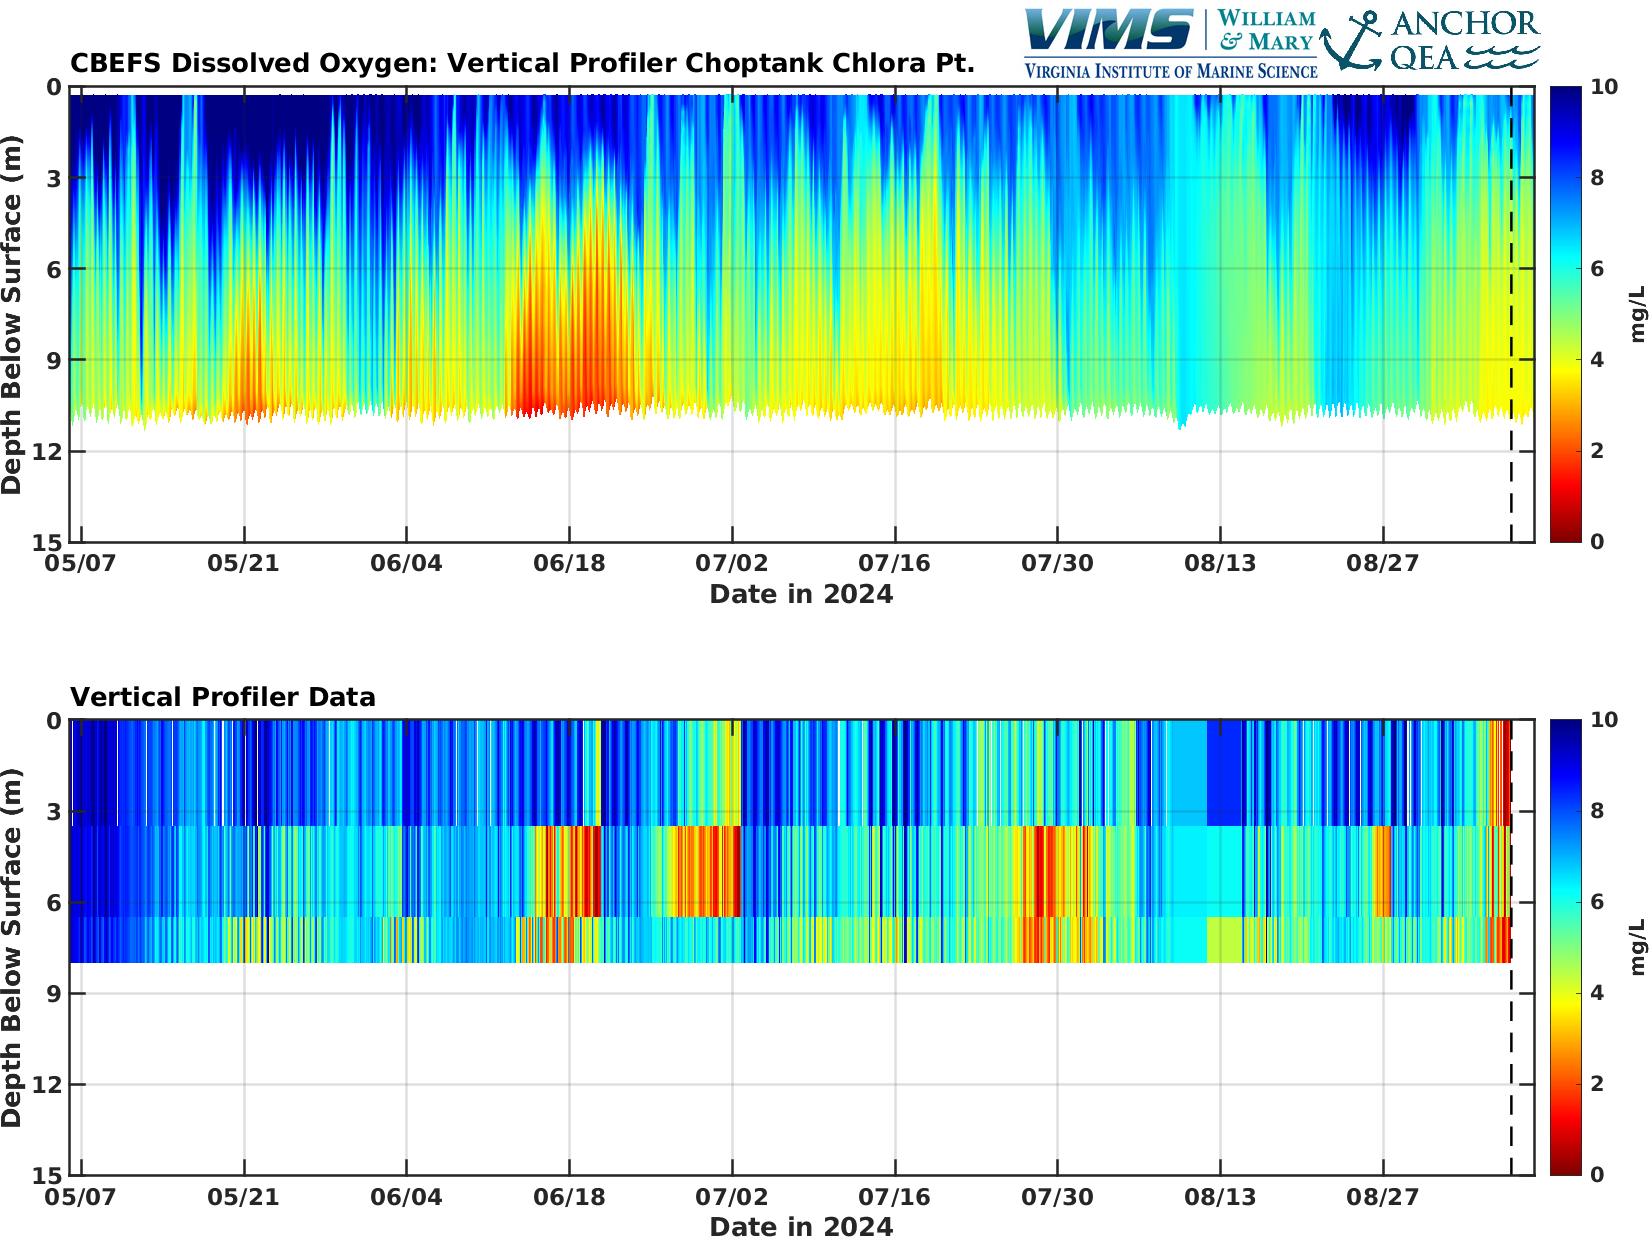
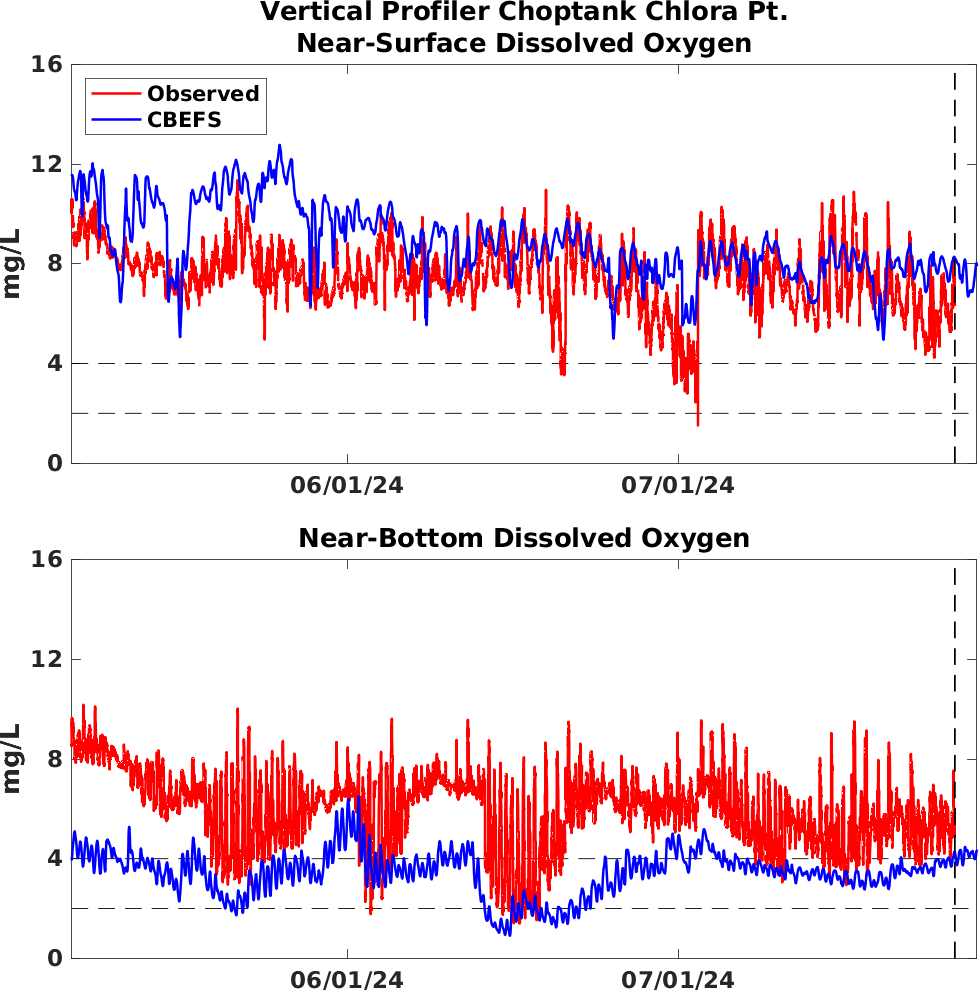
Vertical Profile Comparisons: Dissolved OxygenThis section compares modeled and observed conditions throughout the water column from near the water surface to near the sediment bed. NOAA has installed vertical arrays of sensors at six locations in the Bay to observe dissolved oxygen, salinity, and water temperature at a higher frequency than is available through the long-term Water Quality Monitoring Program data. These high-frequency data at multiple depths allow for the comparison of CBEFS model results to a relatively new type of data set; specifically allowing for the validation of tidal, daily, and weekly variation in the modeled environmental conditions. CBEFS is compared to the data using 2D plots showing time and depth and line plots showing the near-surface and near-bottom values.
----------------------------------------------------------------------------------------------------------------------
----------------------------------------------------------------------------------------------------------------------
----------------------------------------------------------------------------------------------------------------------
----------------------------------------------------------------------------------------------------------------------
----------------------------------------------------------------------------------------------------------------------
|
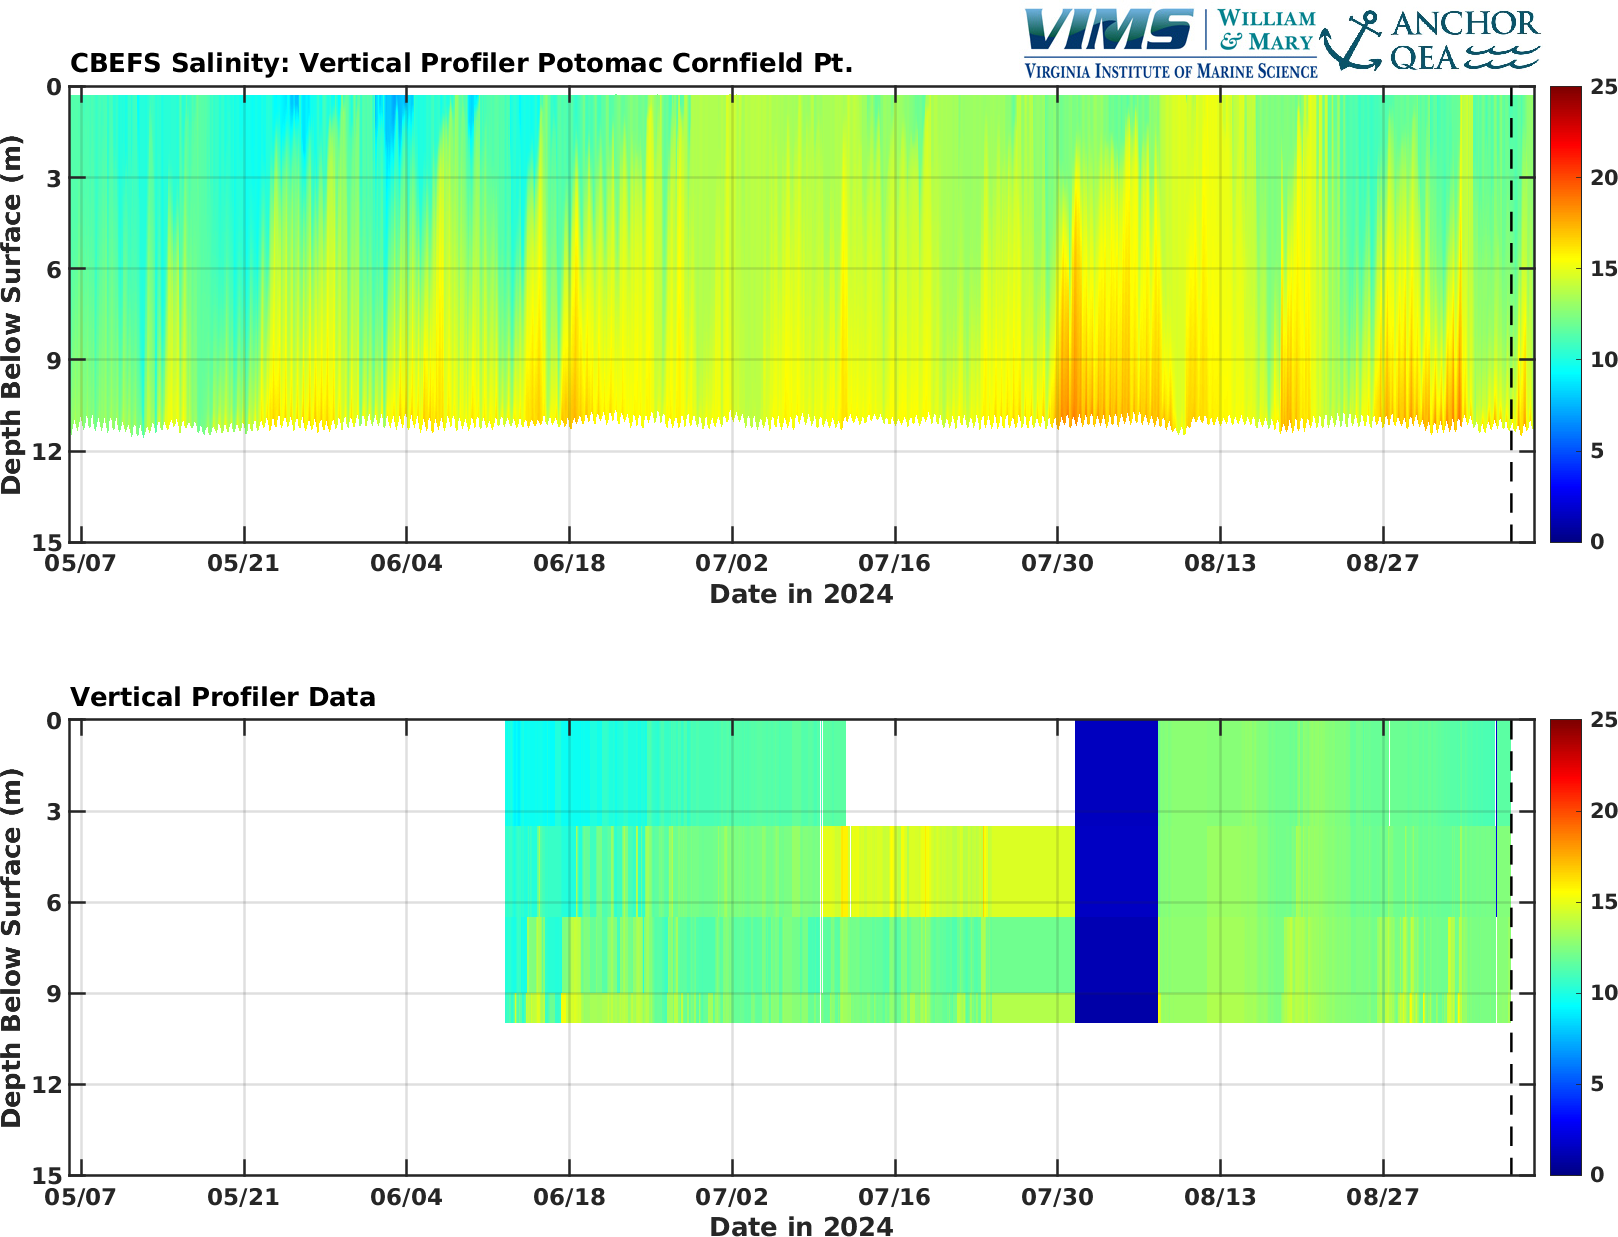
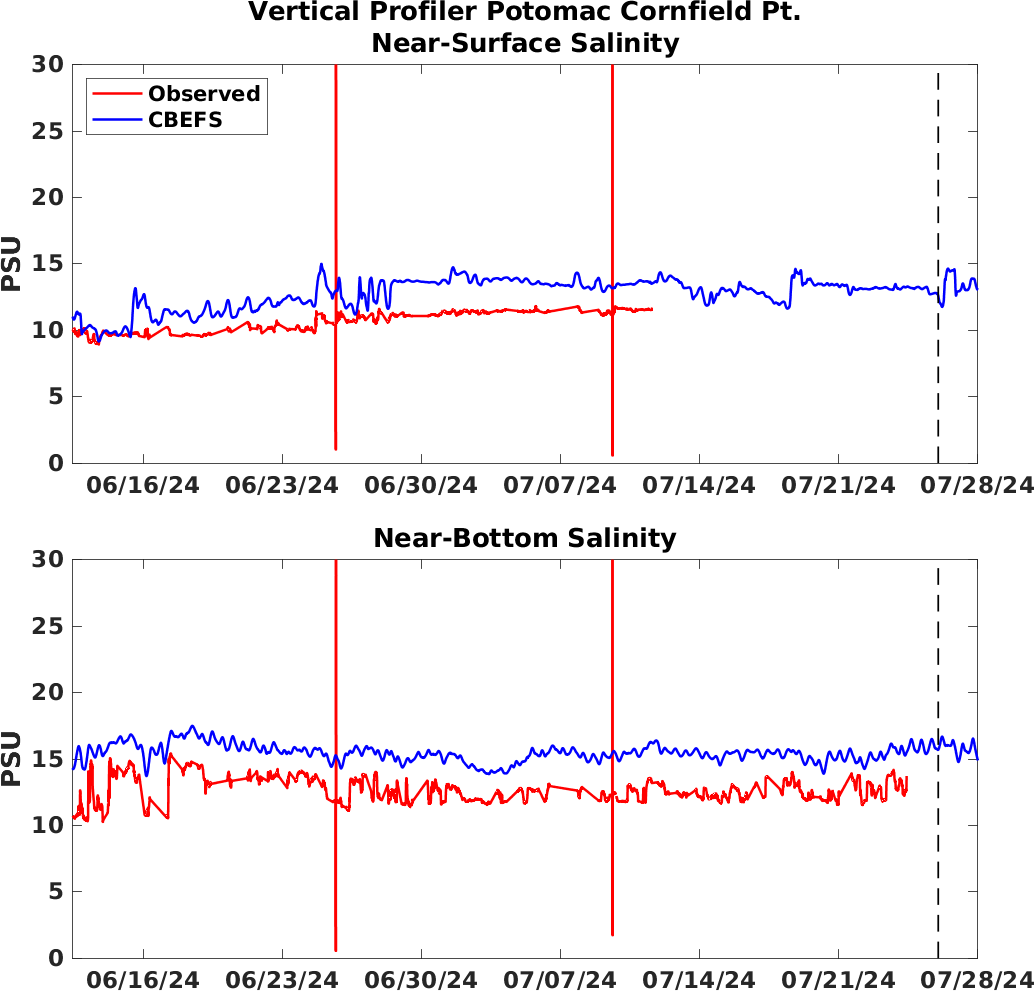
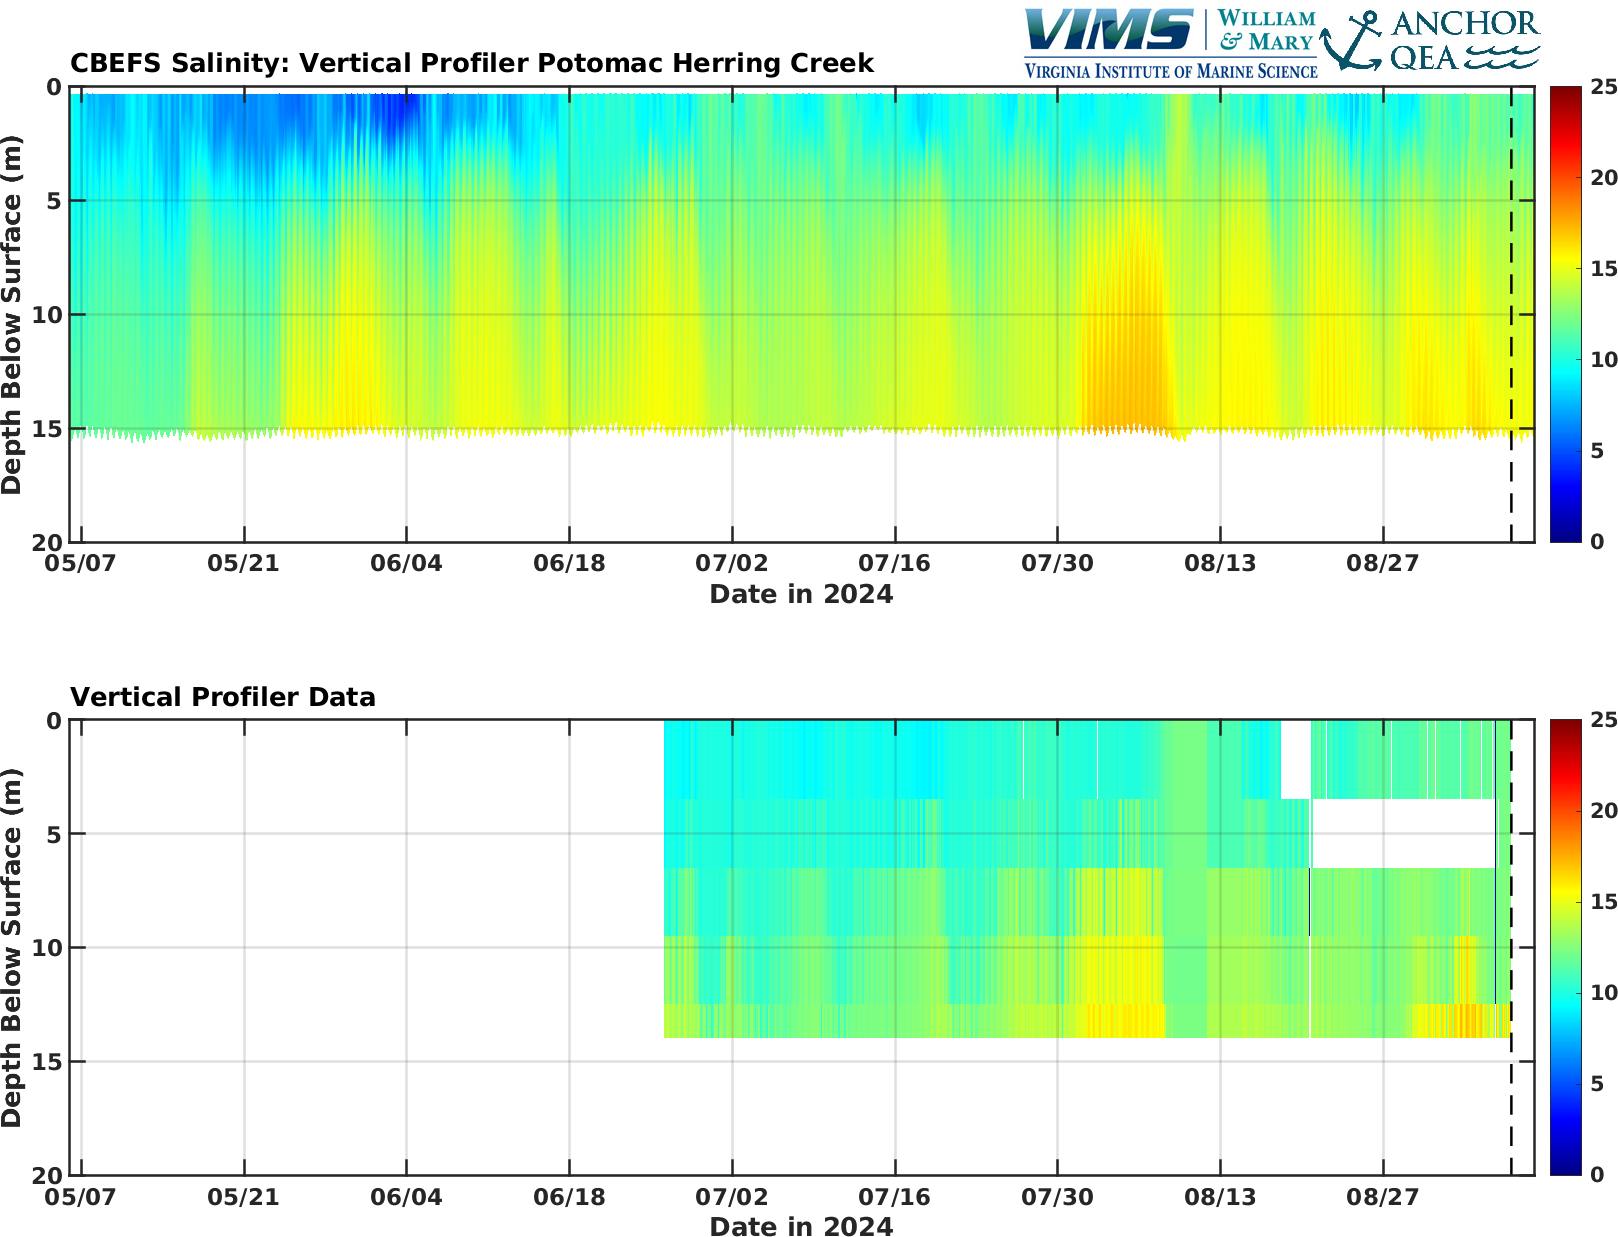
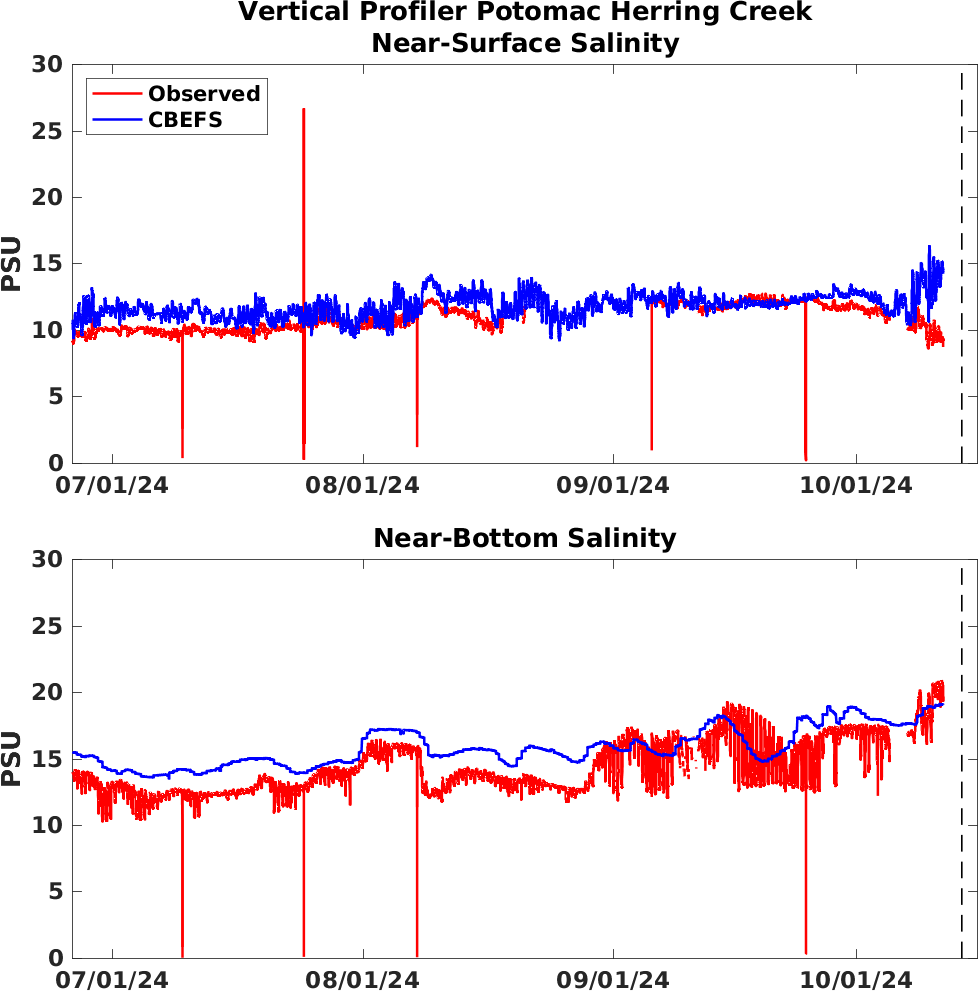
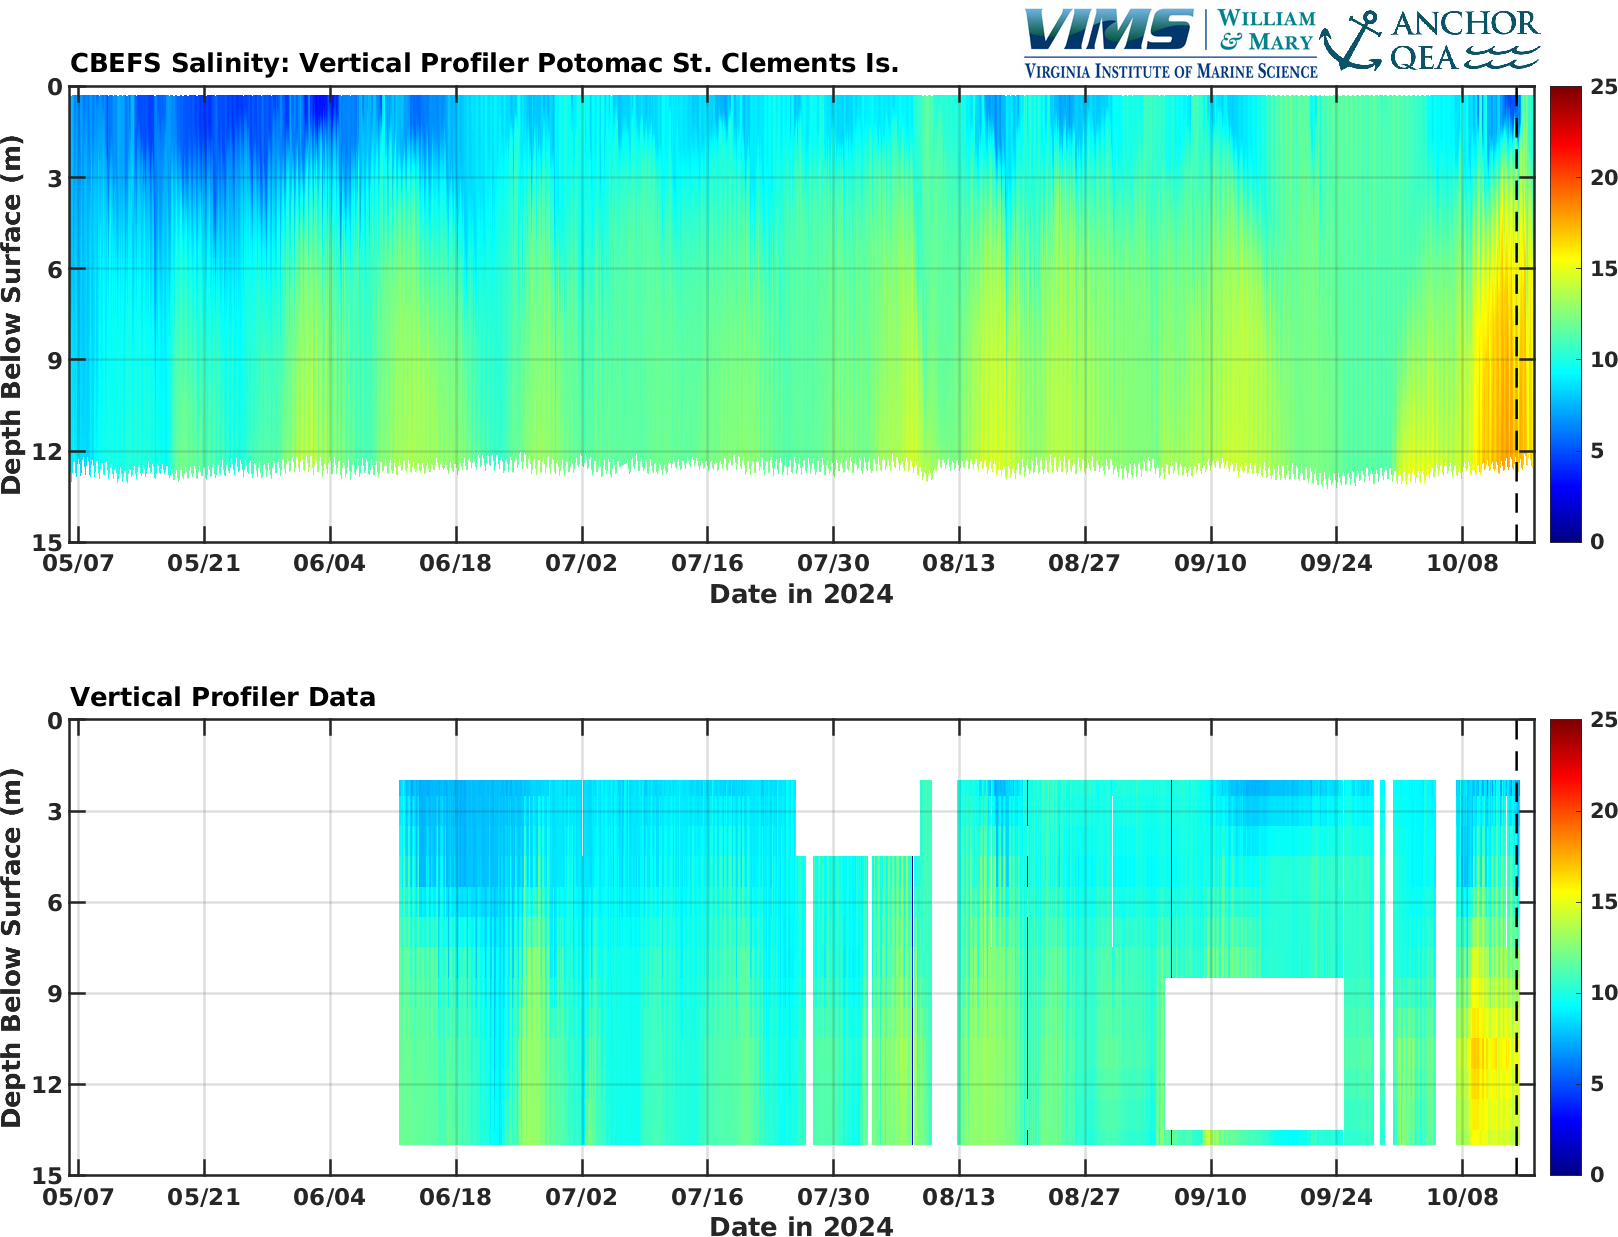
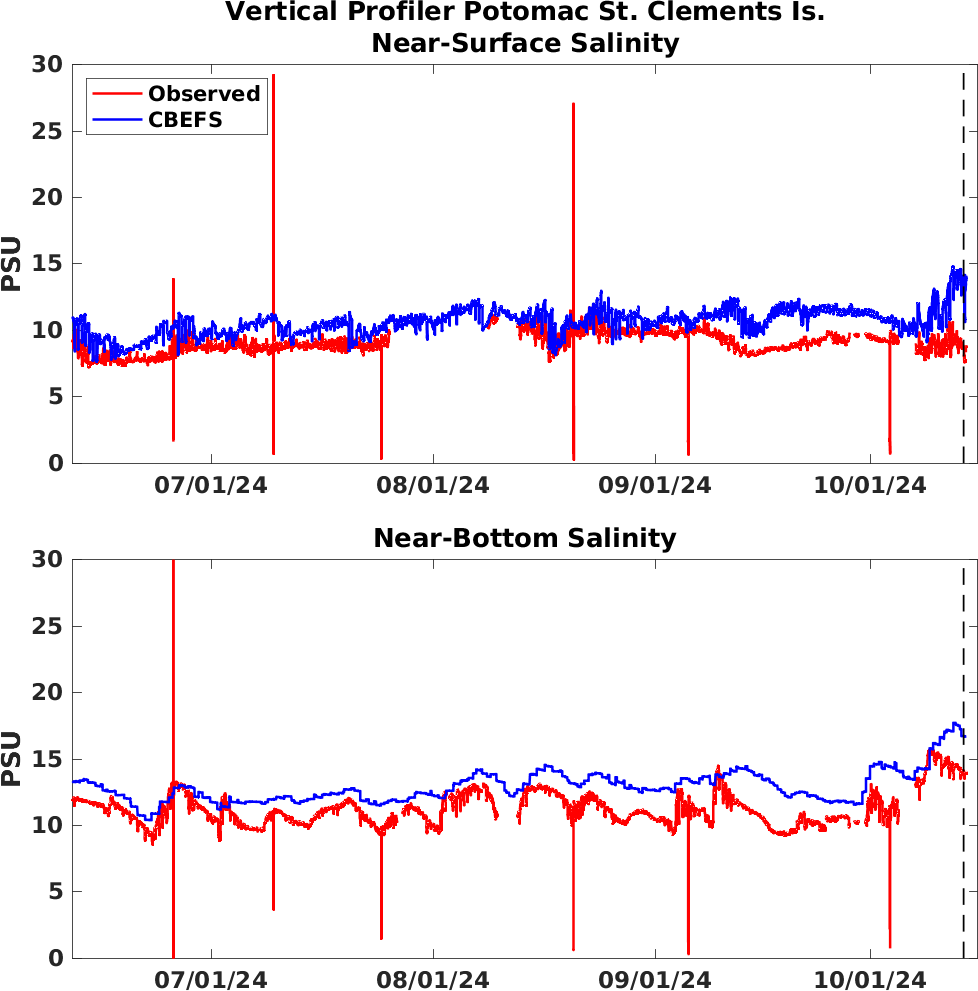
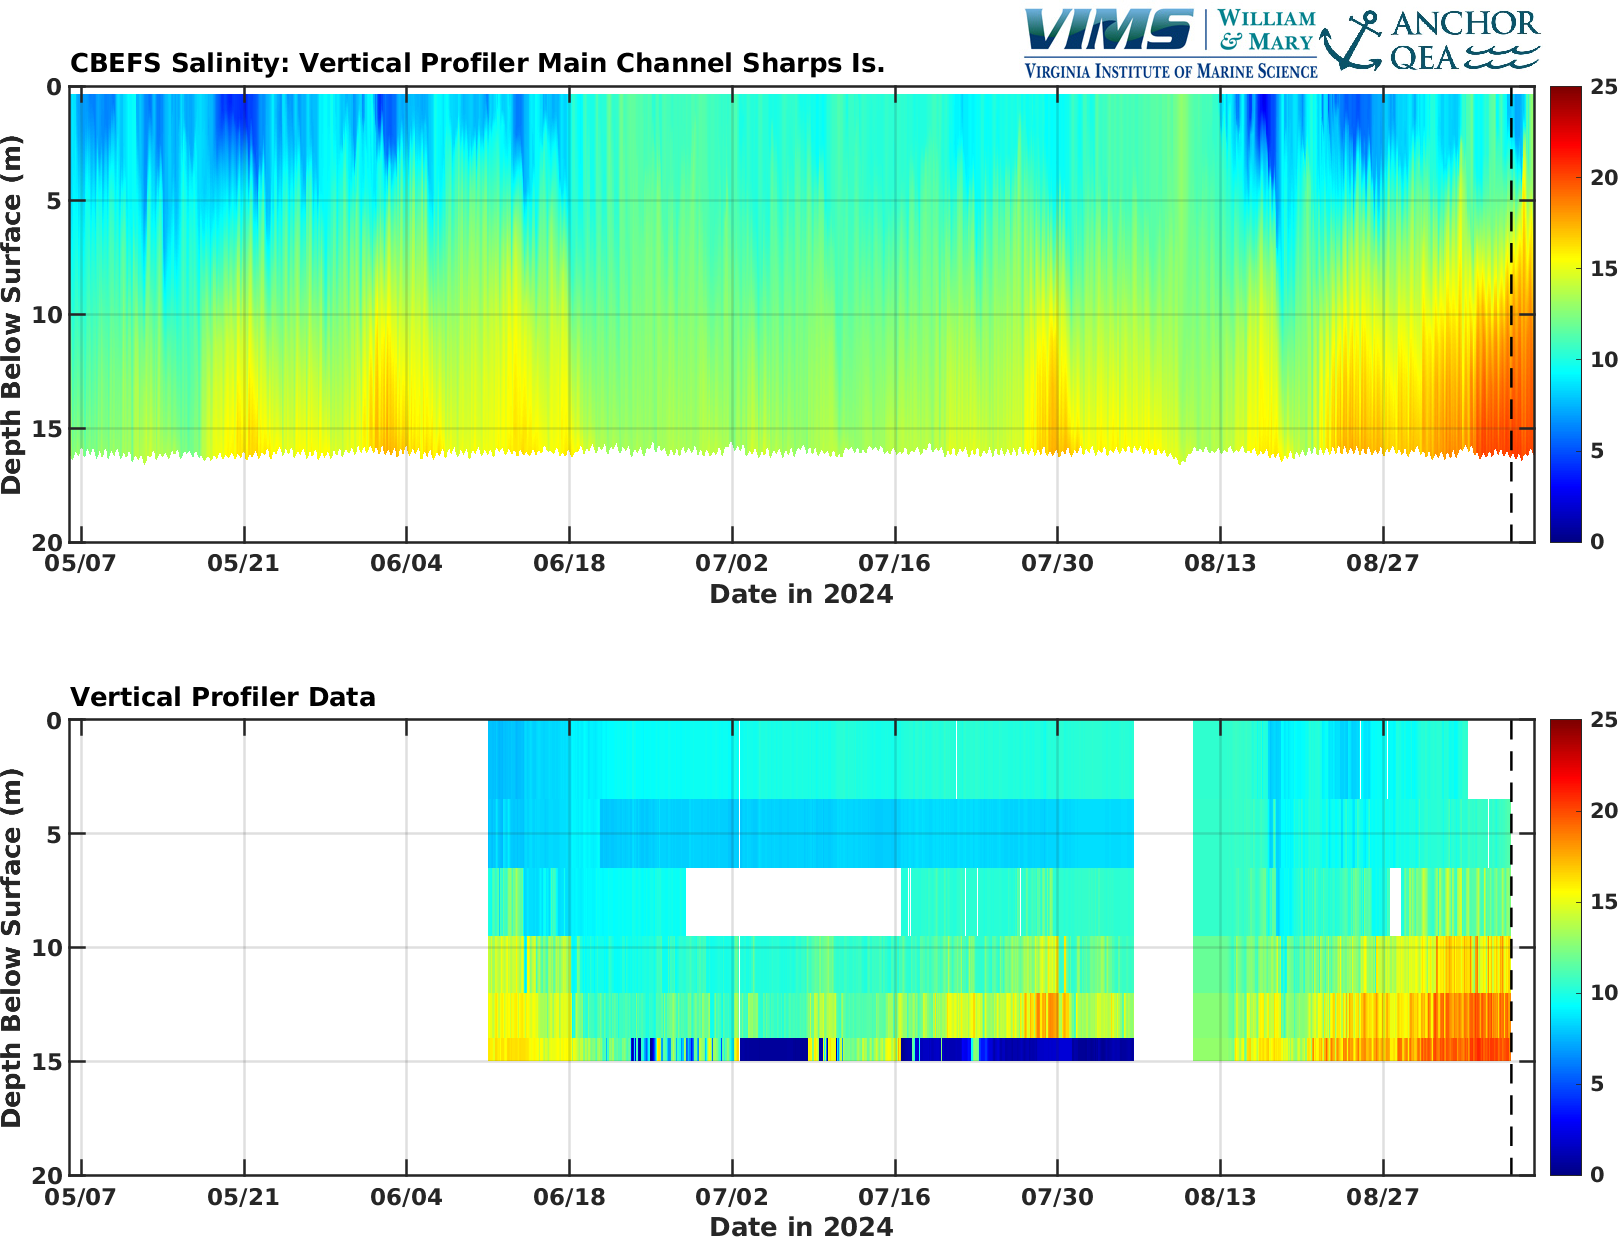
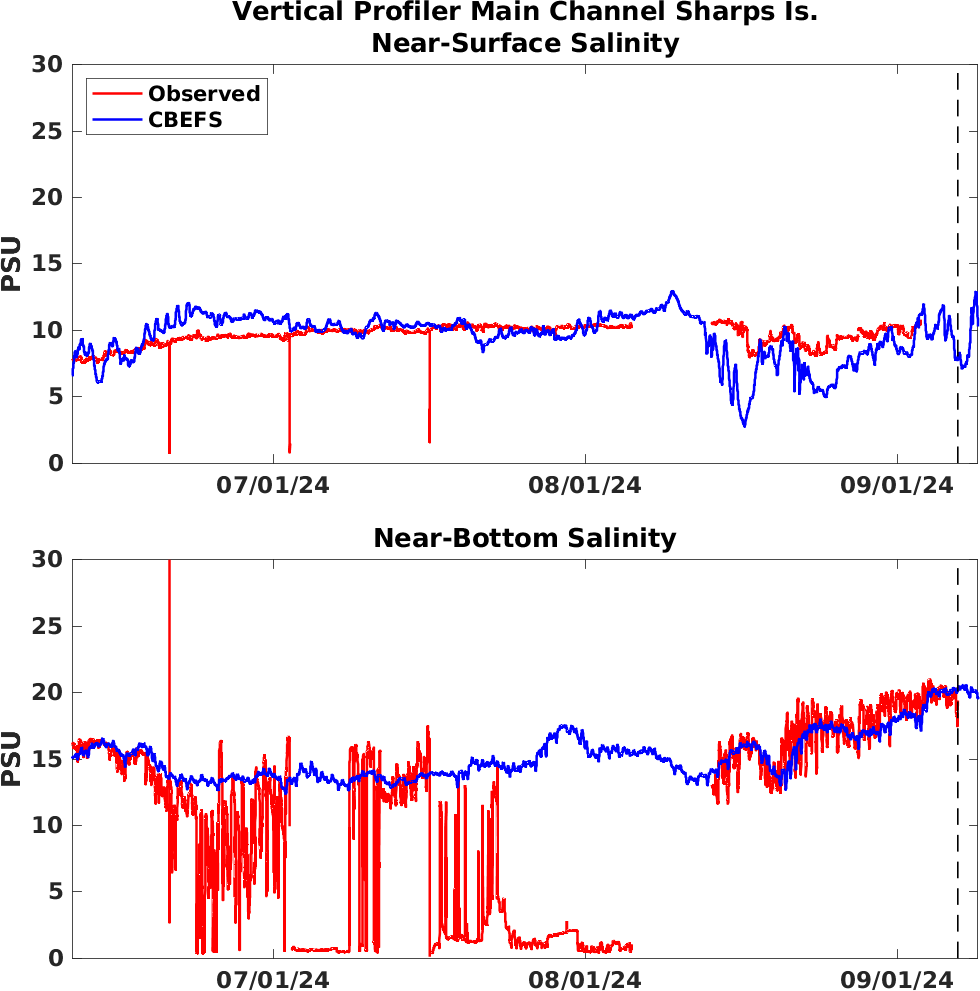
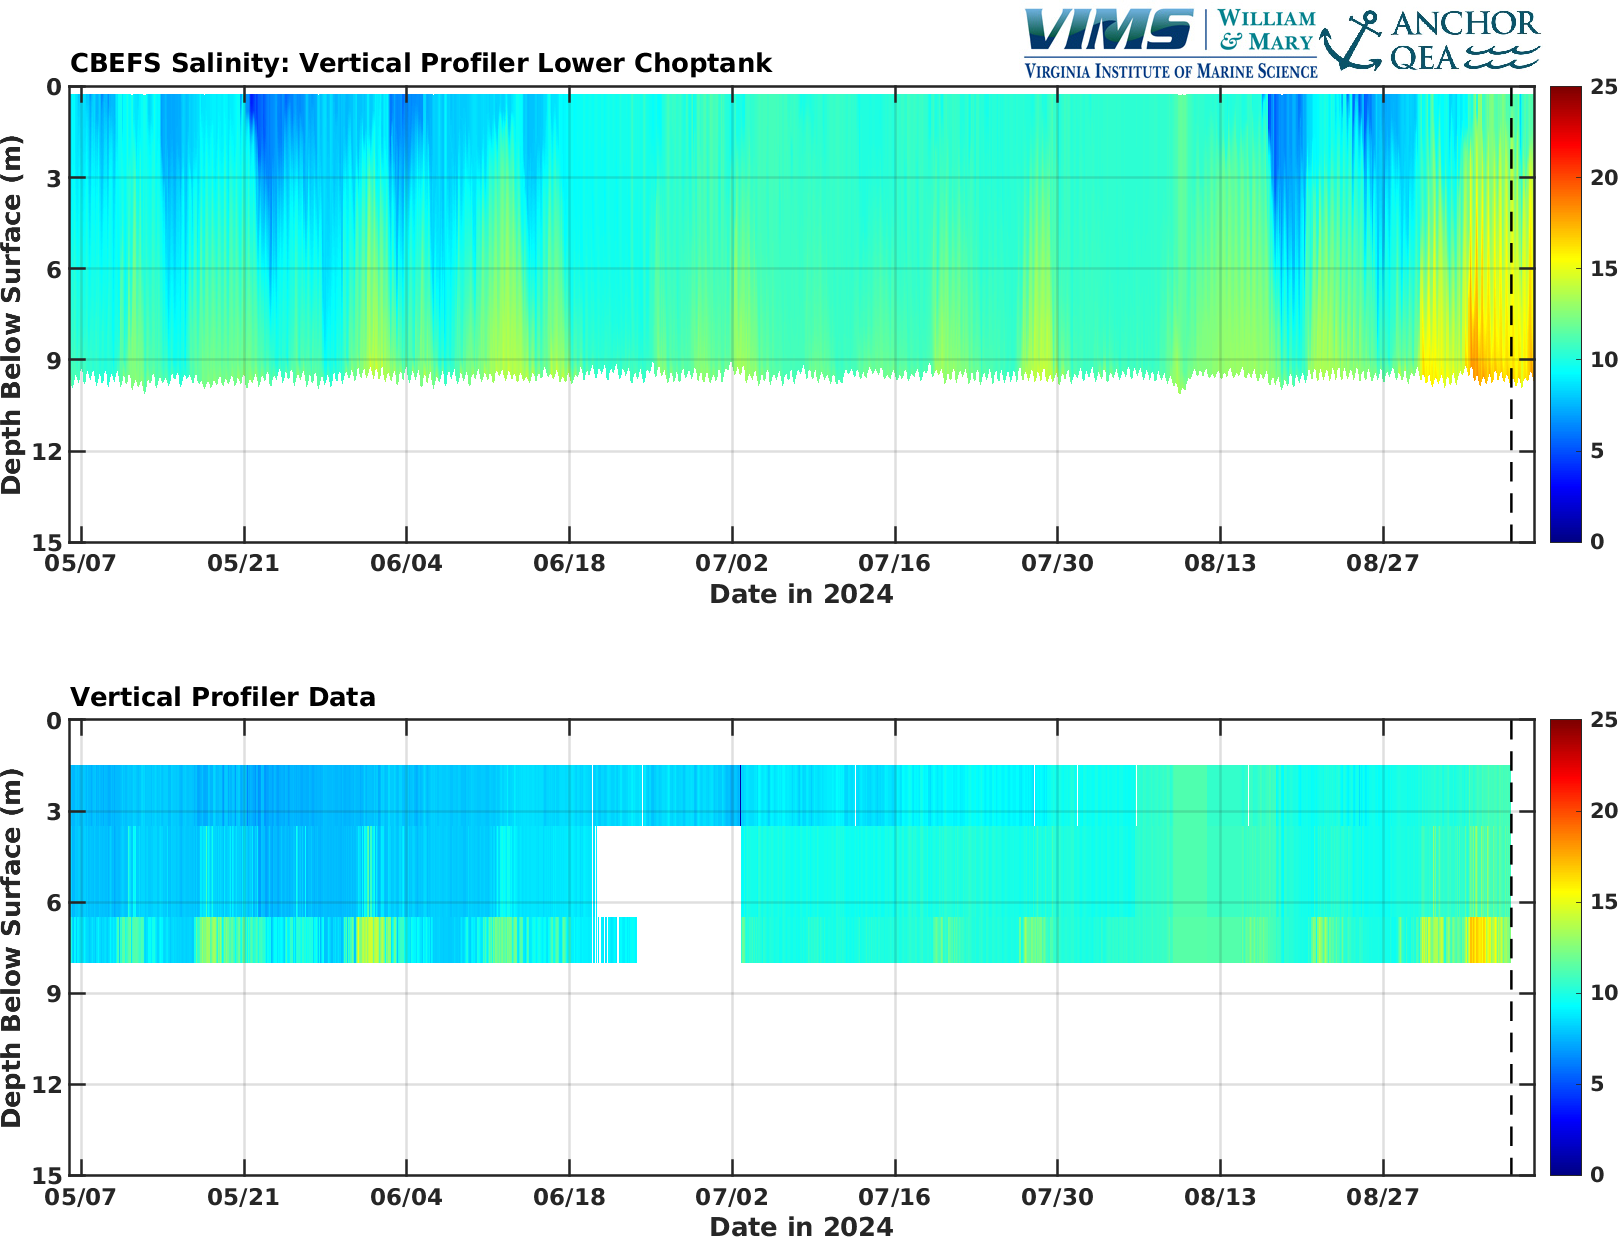
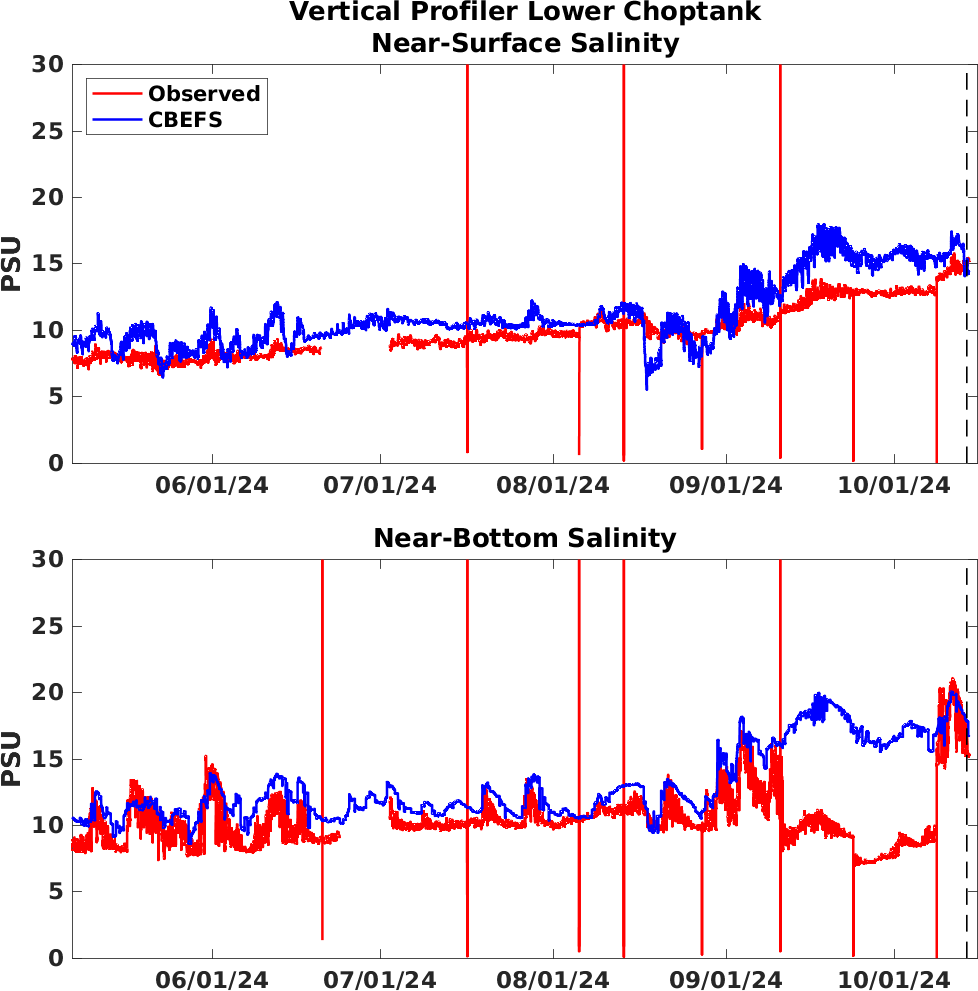
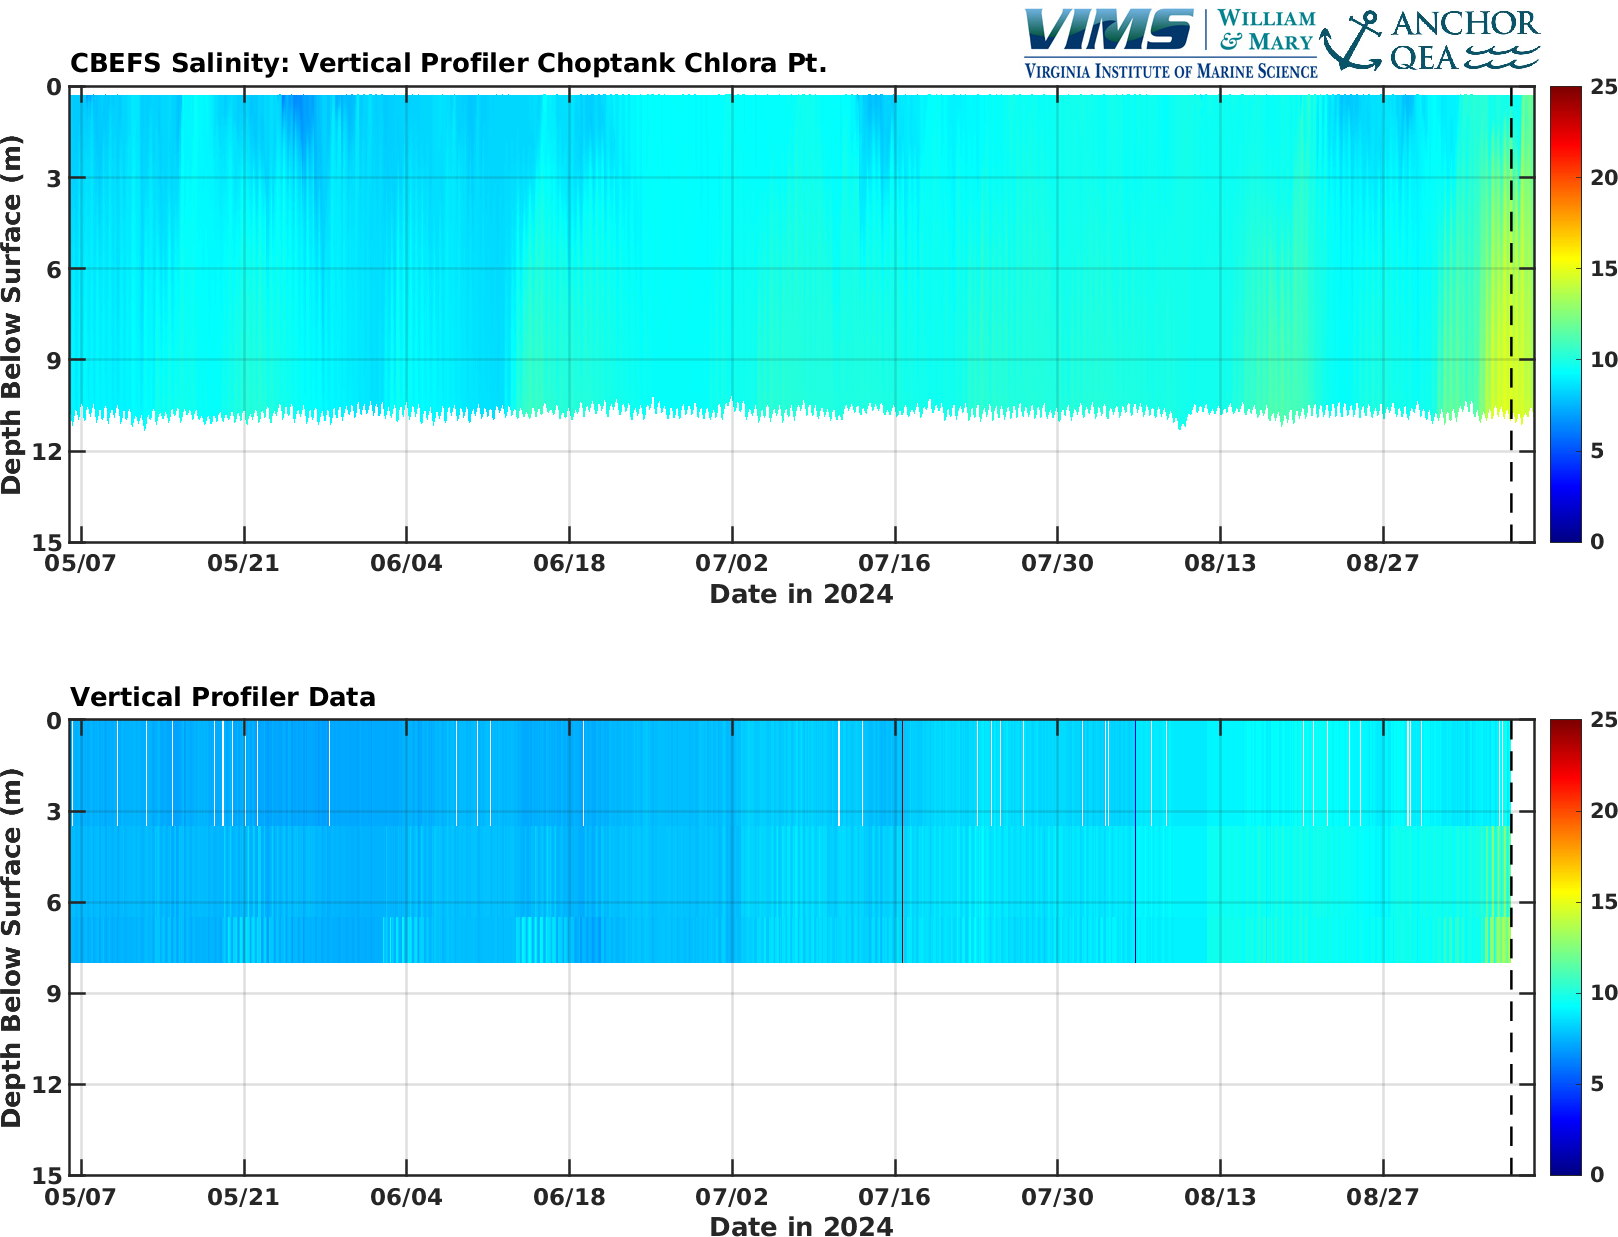
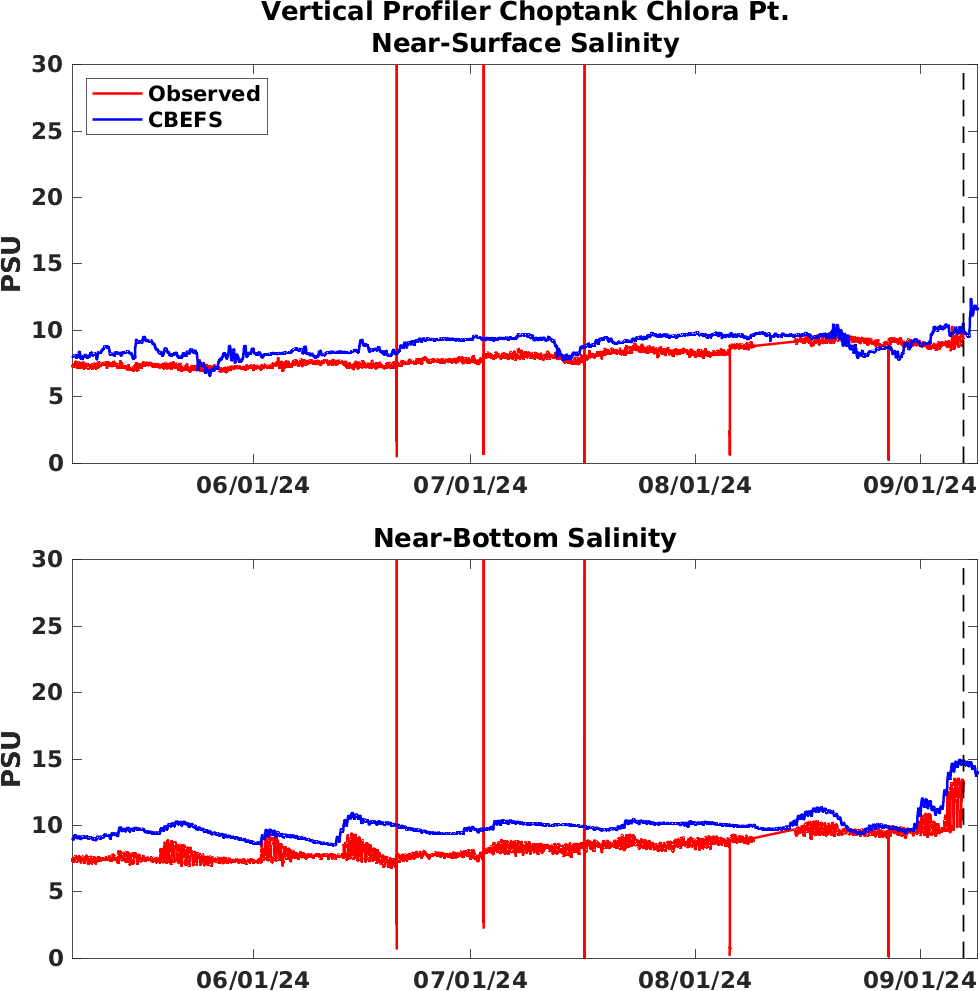
Vertical Profile Comparisons: SalinityThis section compares modeled and observed conditions throughout the water column from near the water surface to near the sediment bed. NOAA has installed vertical arrays of sensors at six locations in the Bay to observe dissolved oxygen, salinity, and water temperature at a higher frequency than is available through the long-term Water Quality Monitoring Program data. These high-frequency data at multiple depths allow for the comparison of CBEFS model results to a relatively new type of data set; specifically allowing for the validation of tidal, daily, and weekly variation in the modeled environmental conditions. CBEFS is compared to the data using 2D plots showing time and depth and line plots showing the near-surface and near-bottom values.
----------------------------------------------------------------------------------------------------------------------
----------------------------------------------------------------------------------------------------------------------
----------------------------------------------------------------------------------------------------------------------
----------------------------------------------------------------------------------------------------------------------
----------------------------------------------------------------------------------------------------------------------
|
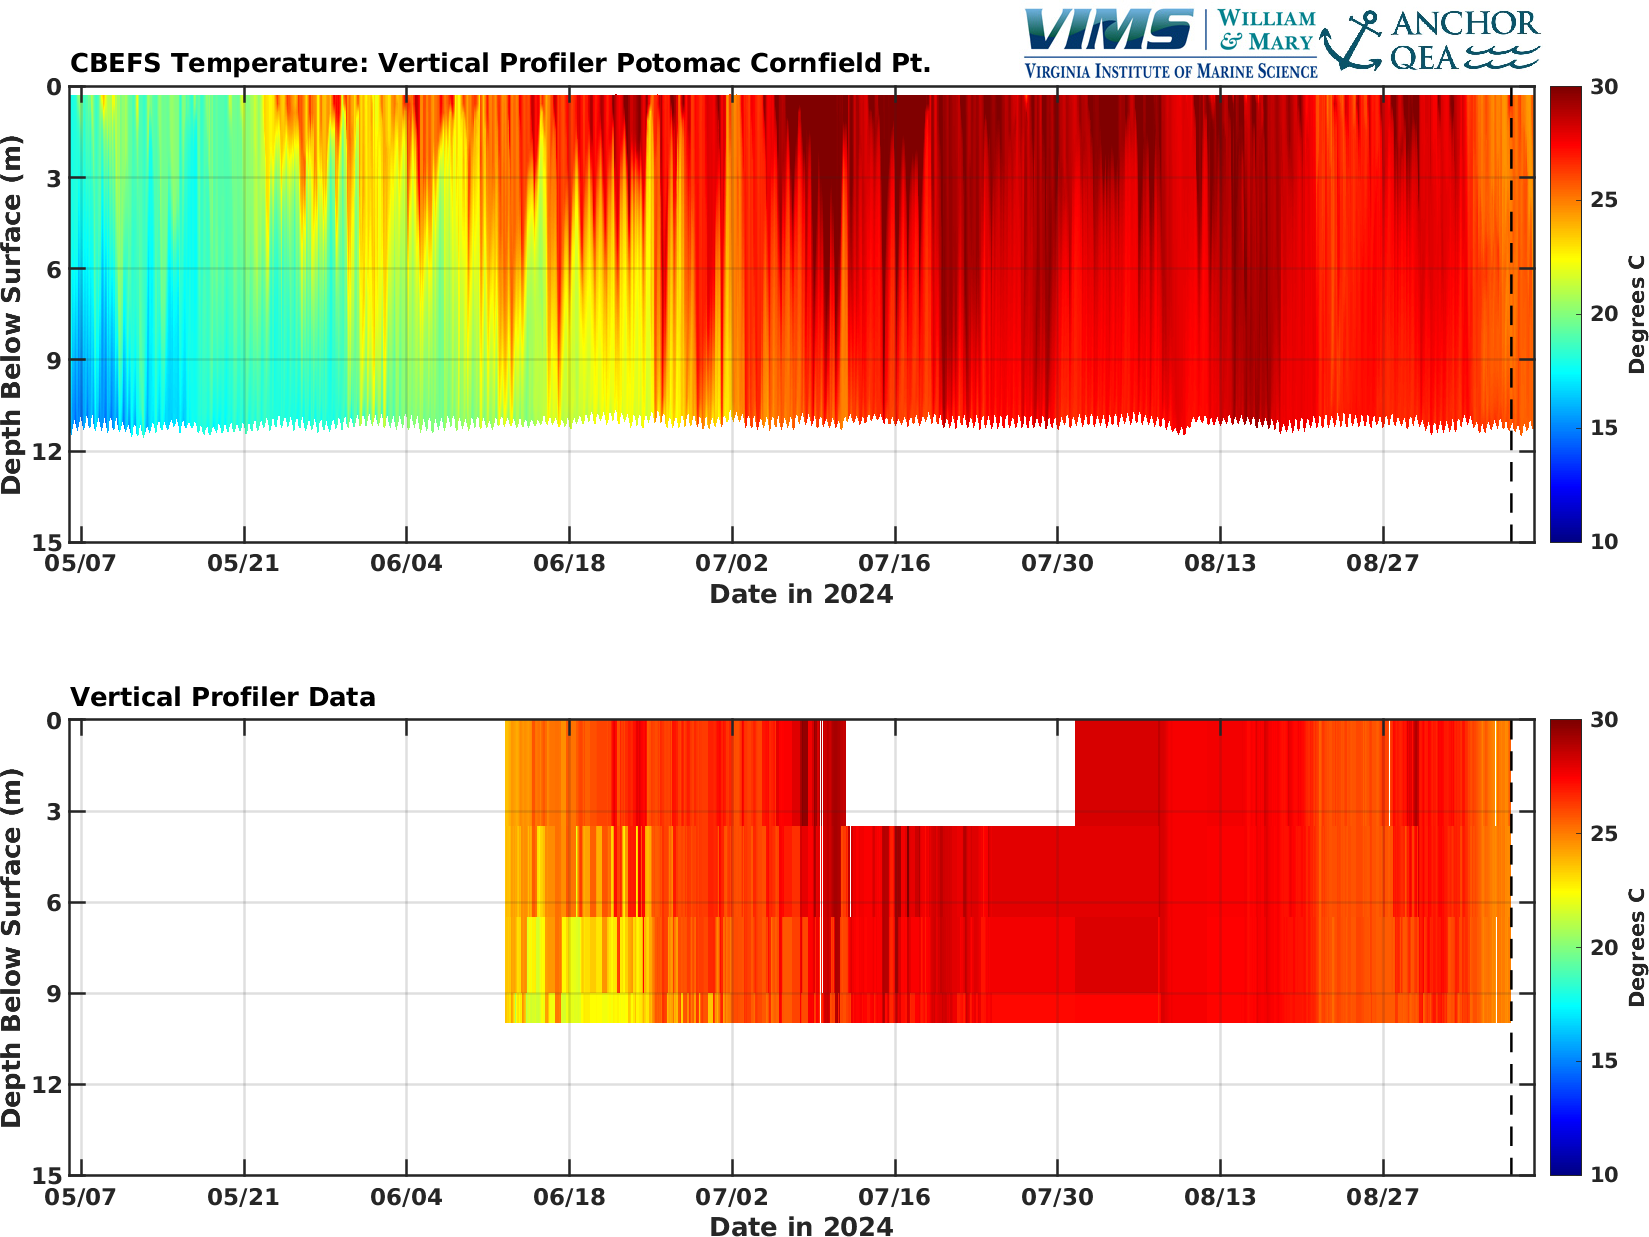
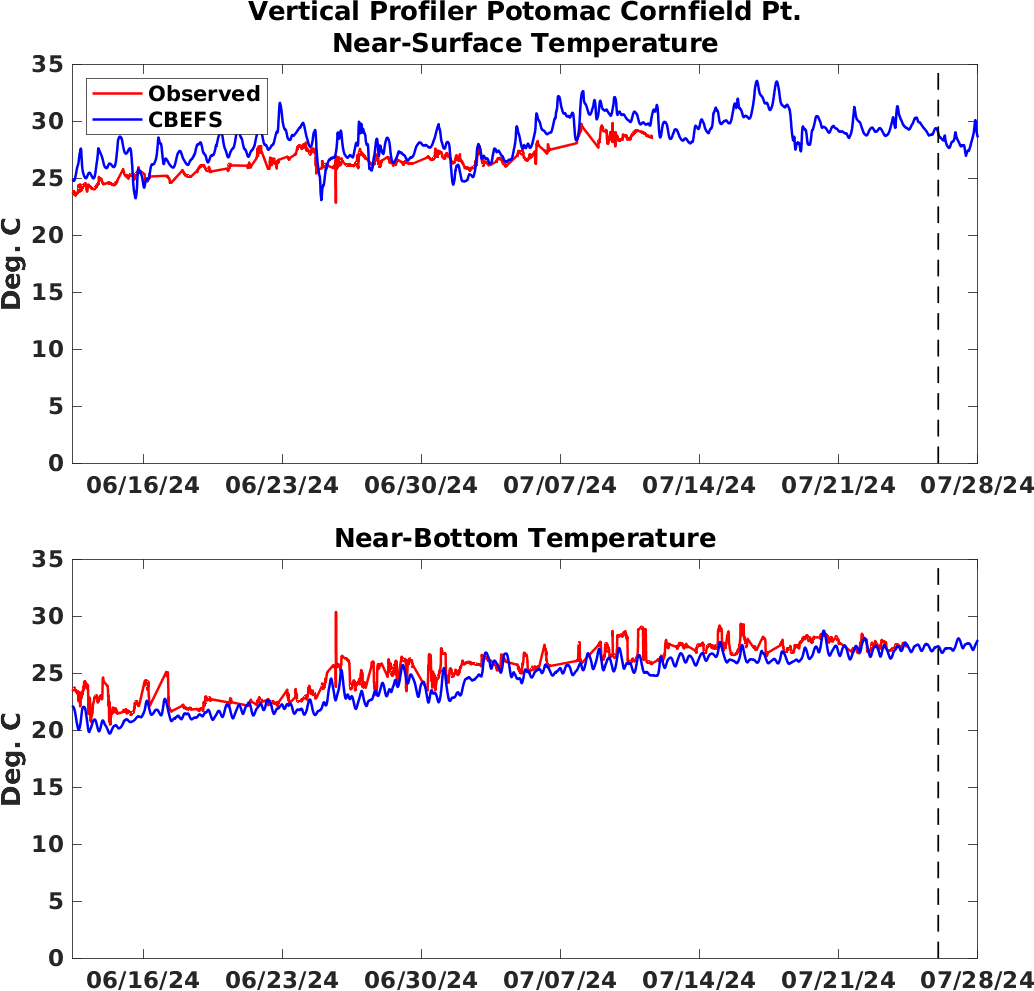
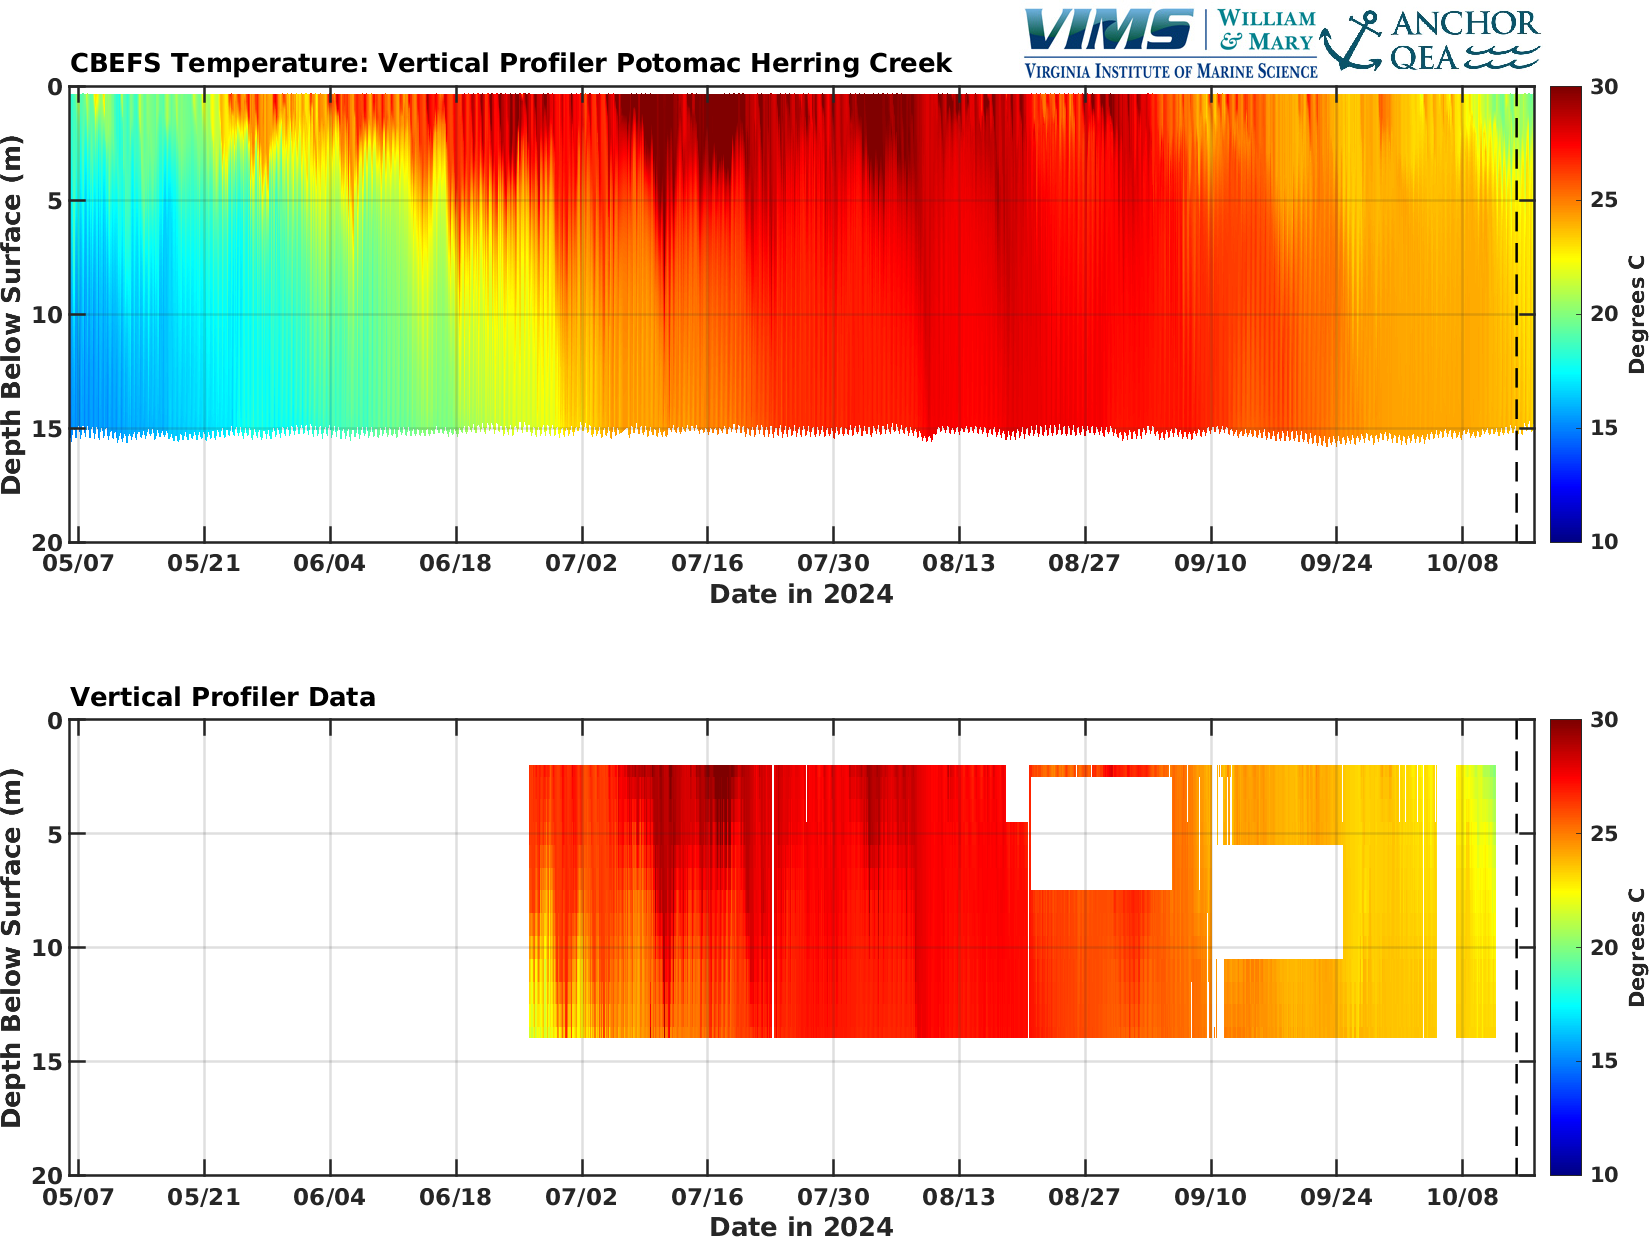
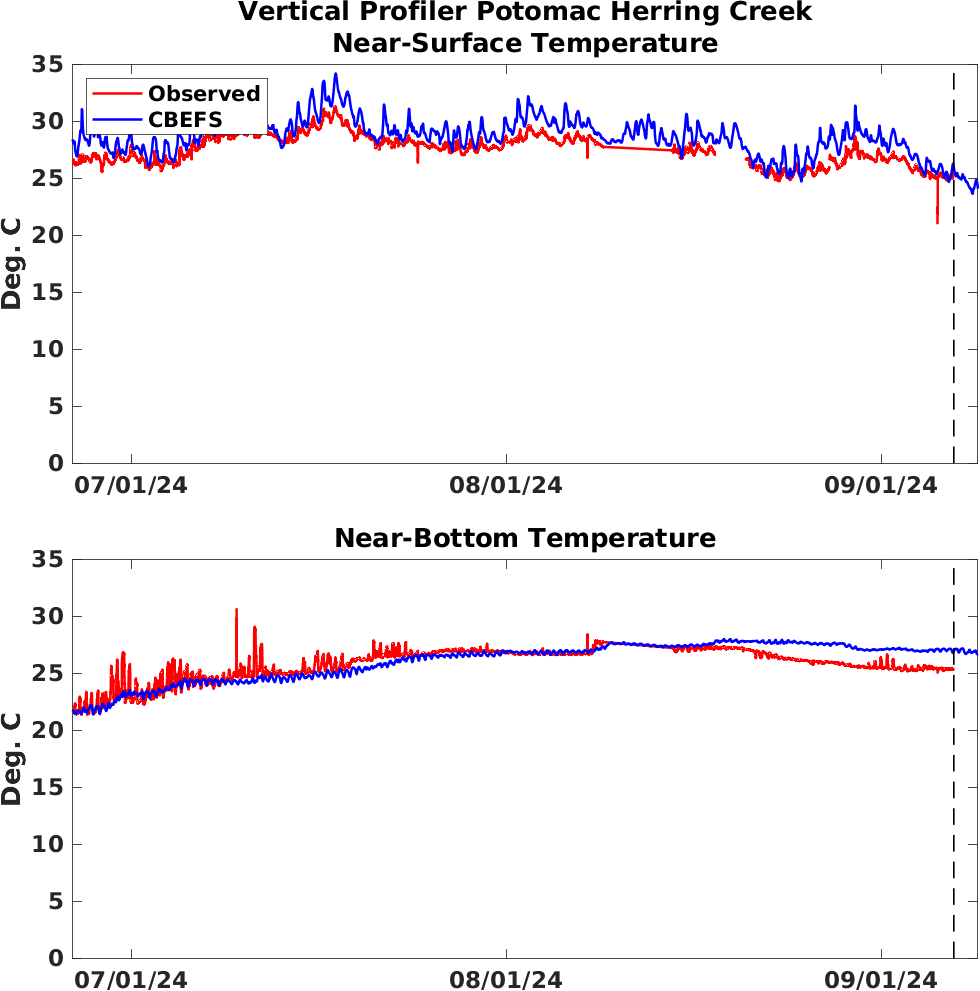
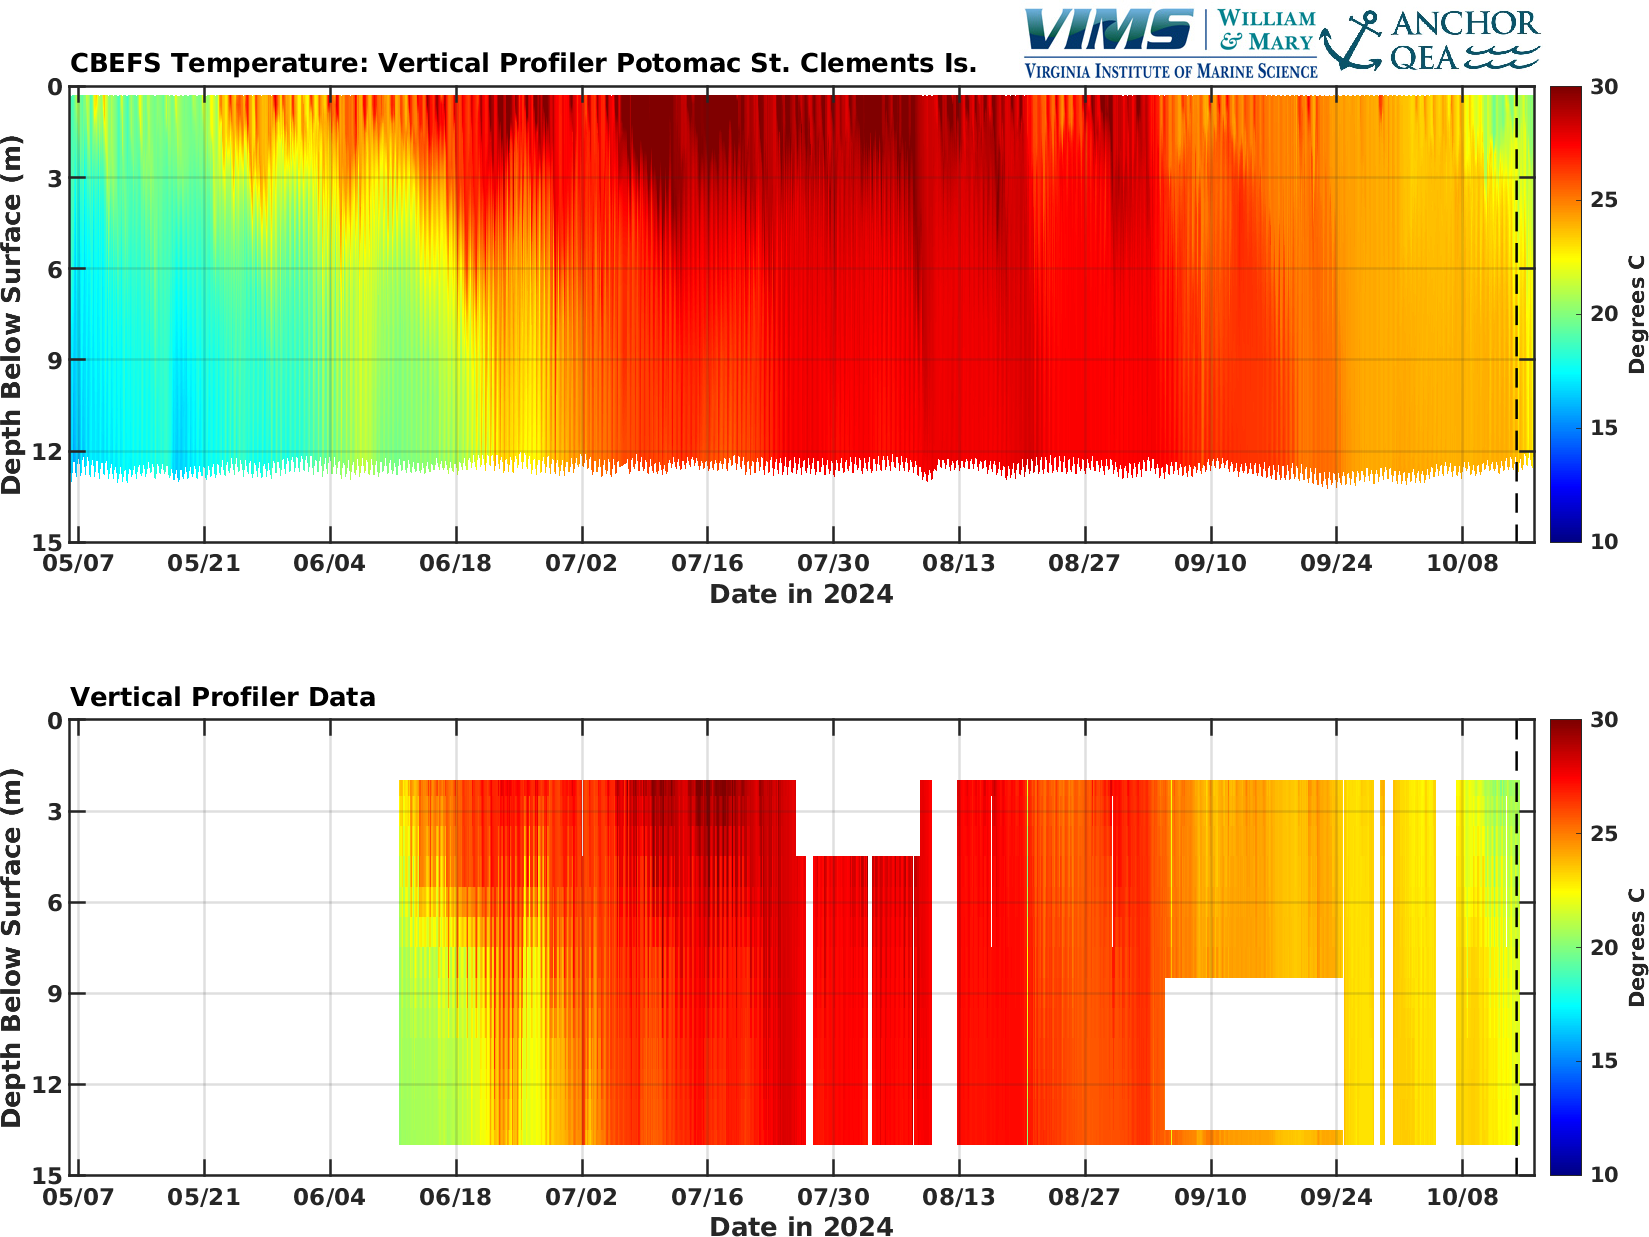
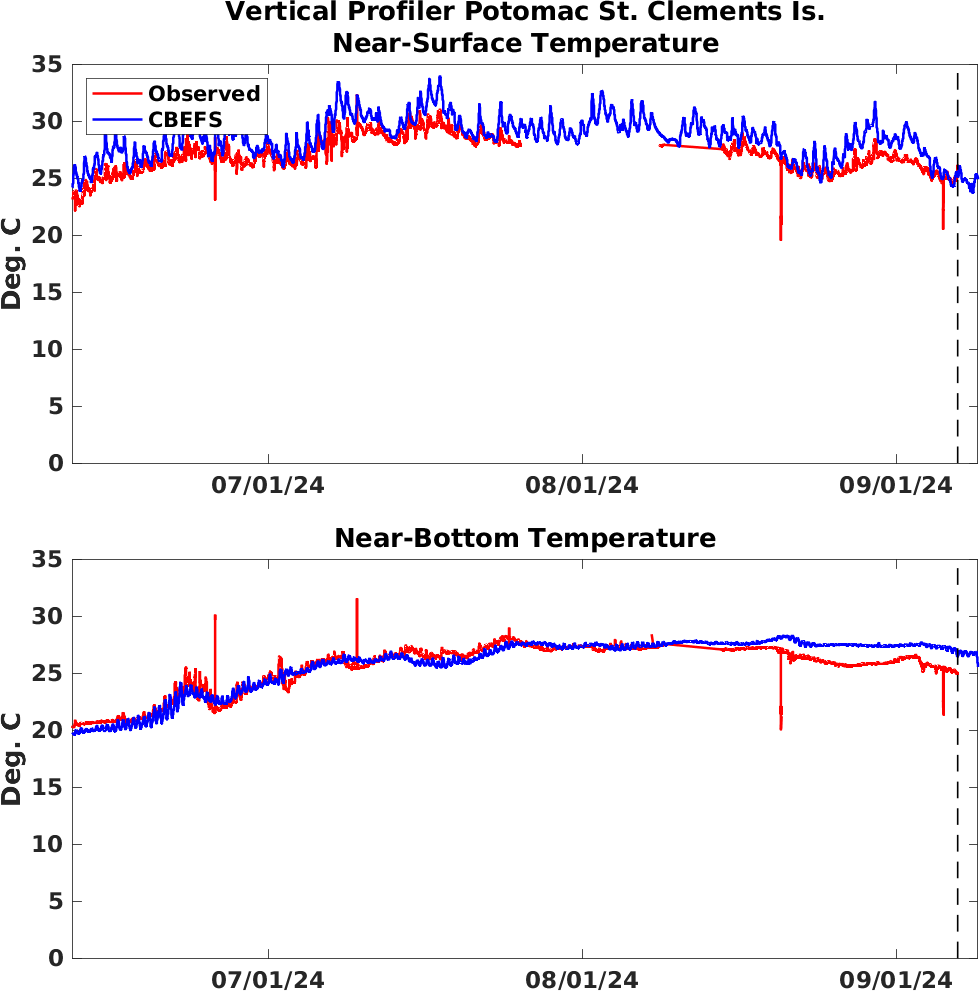
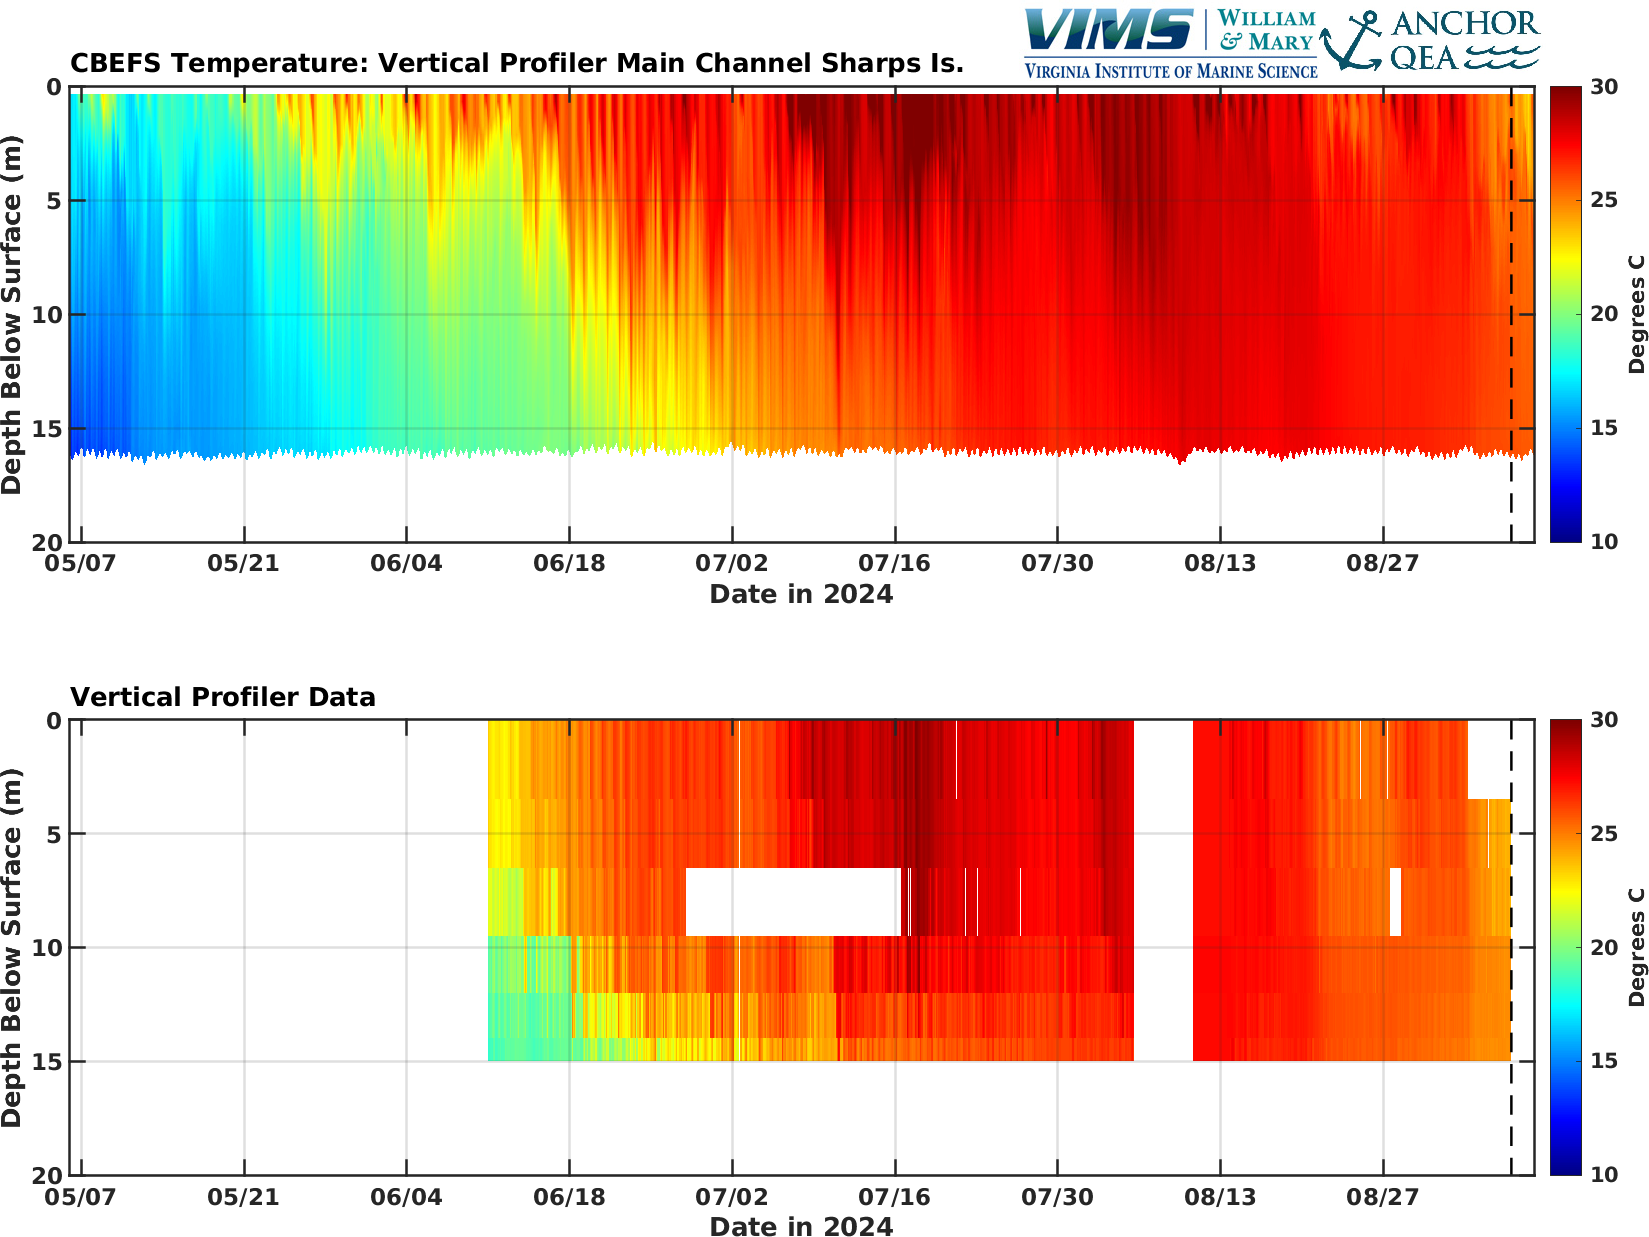
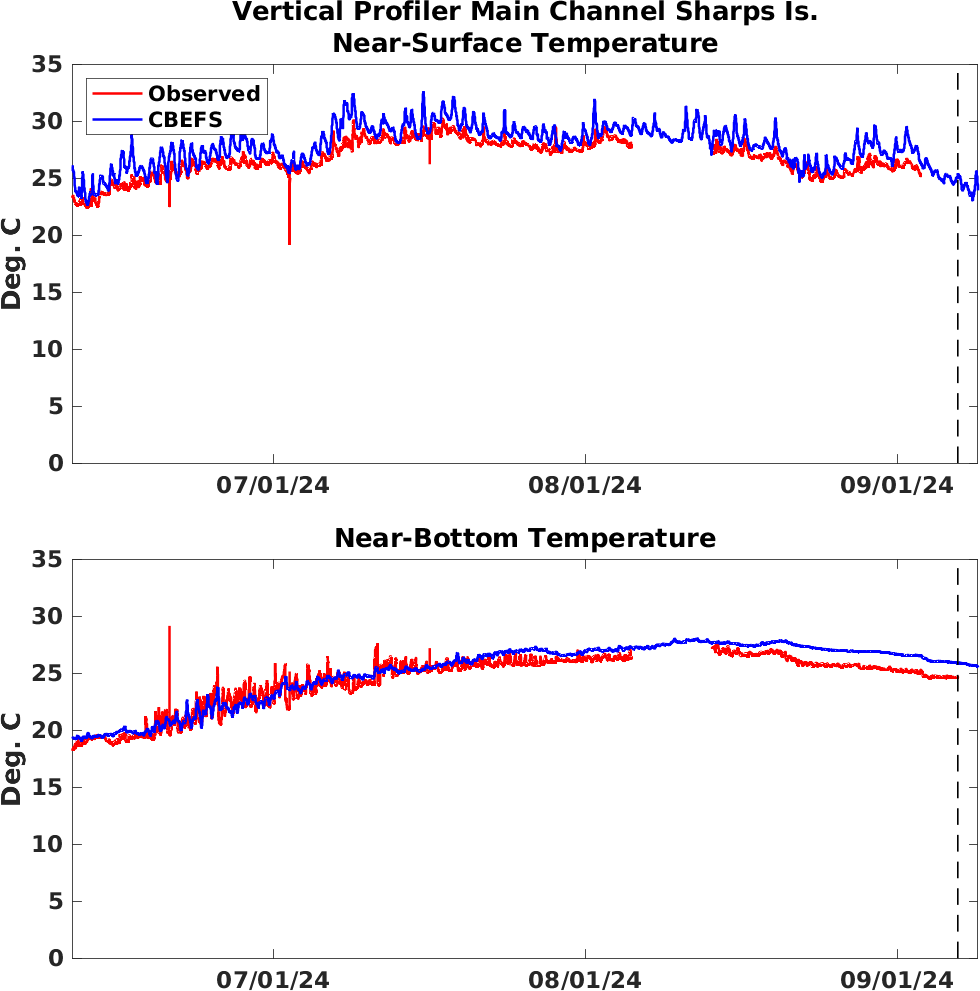
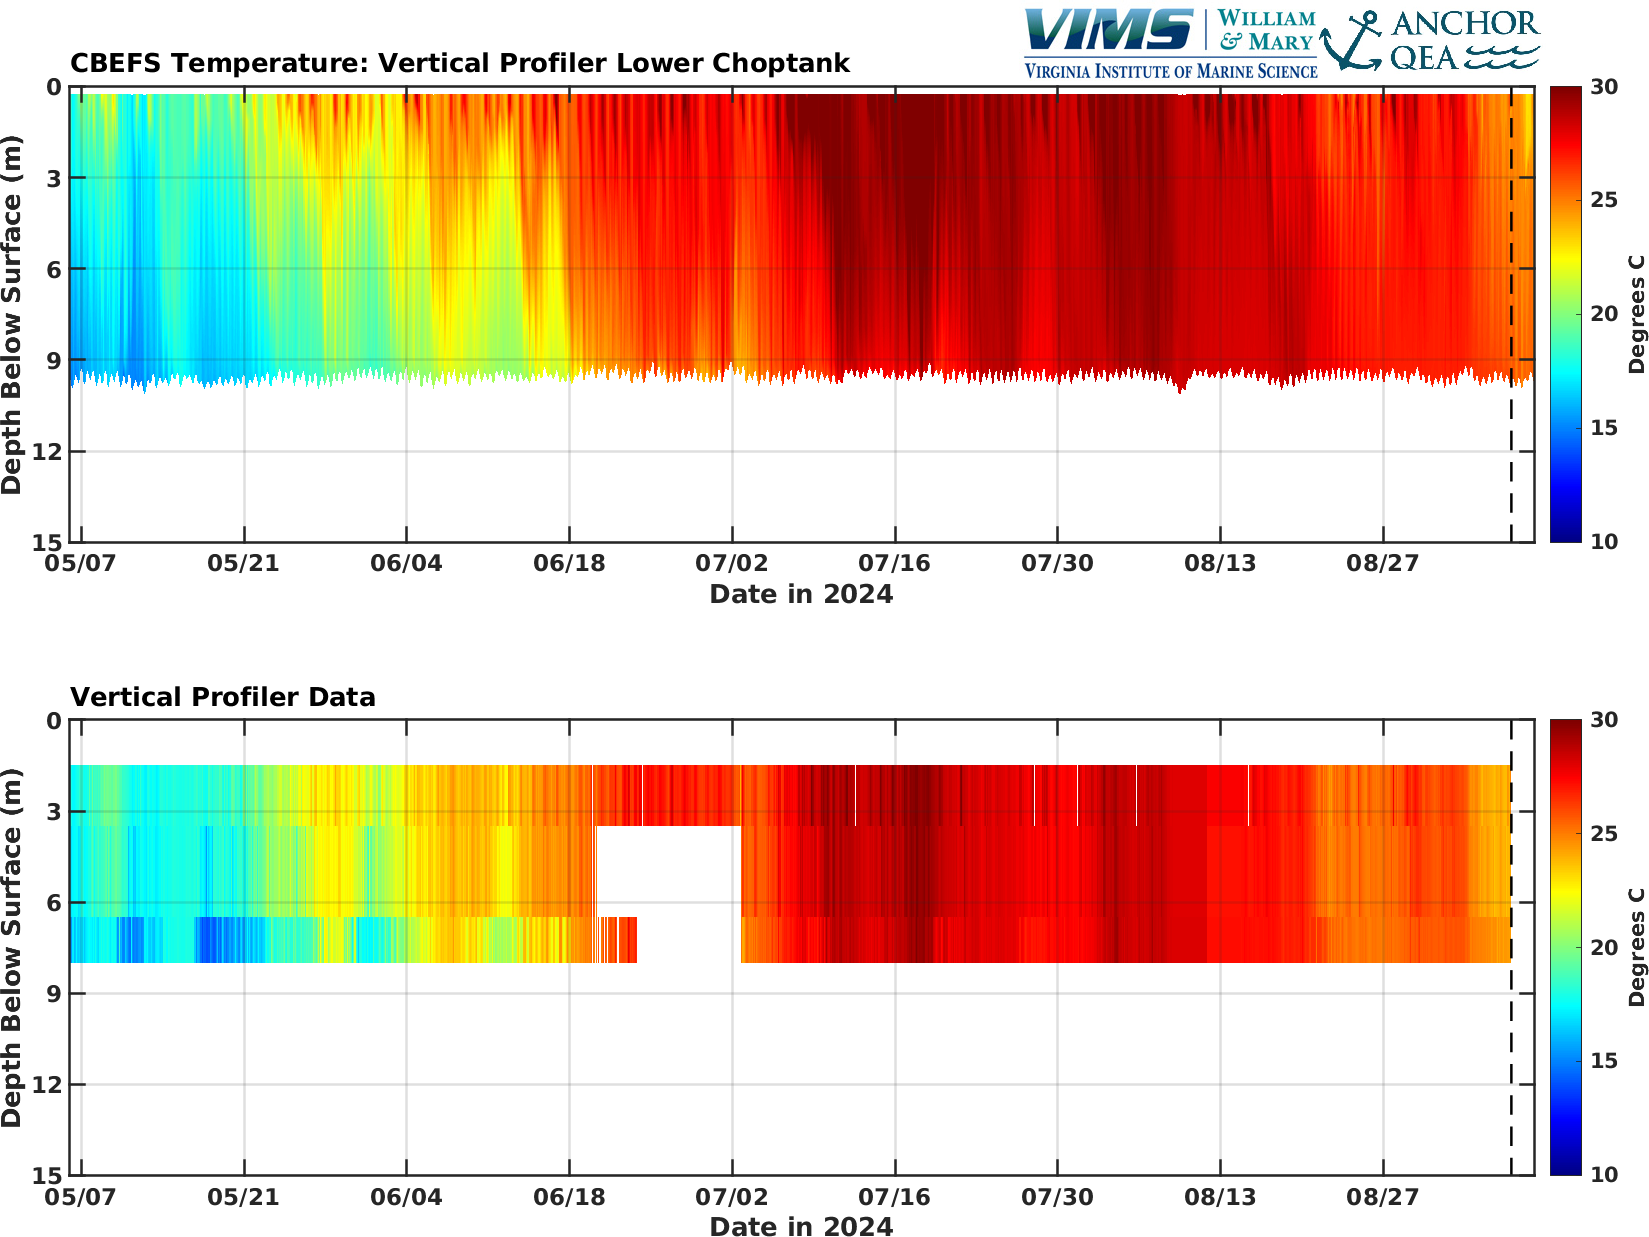
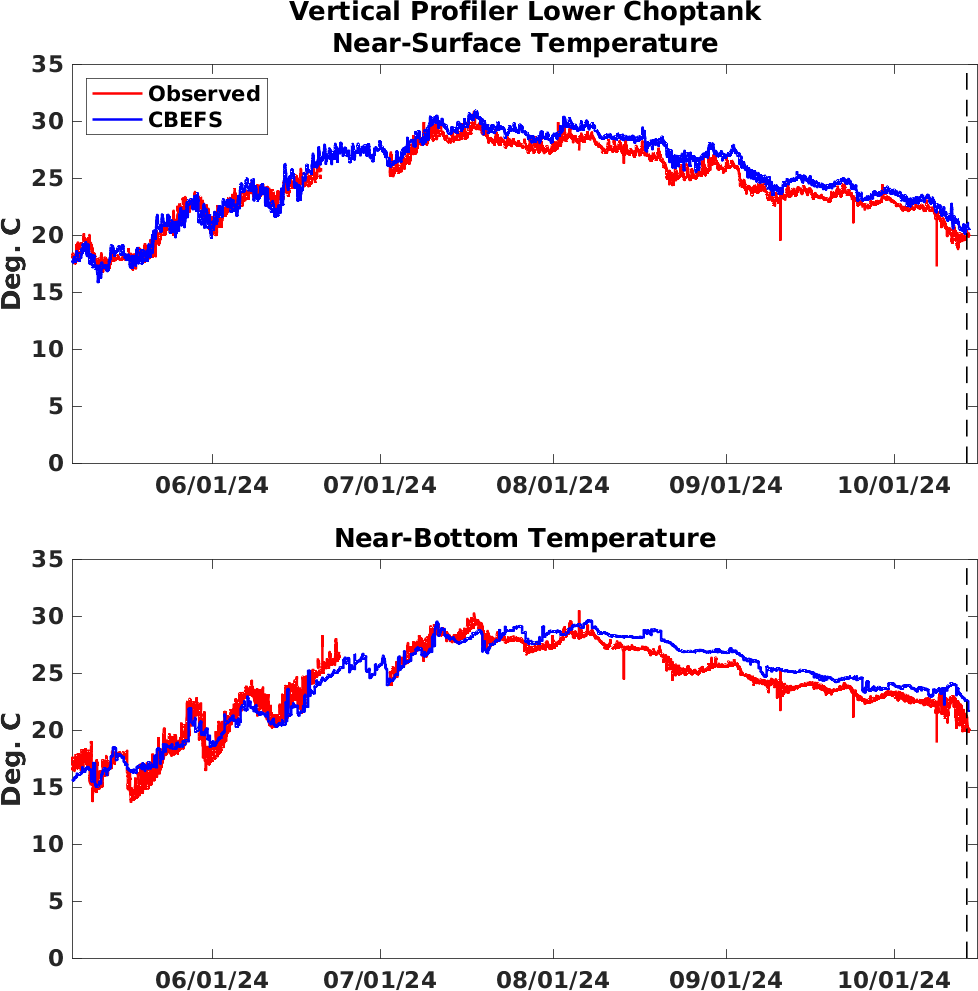
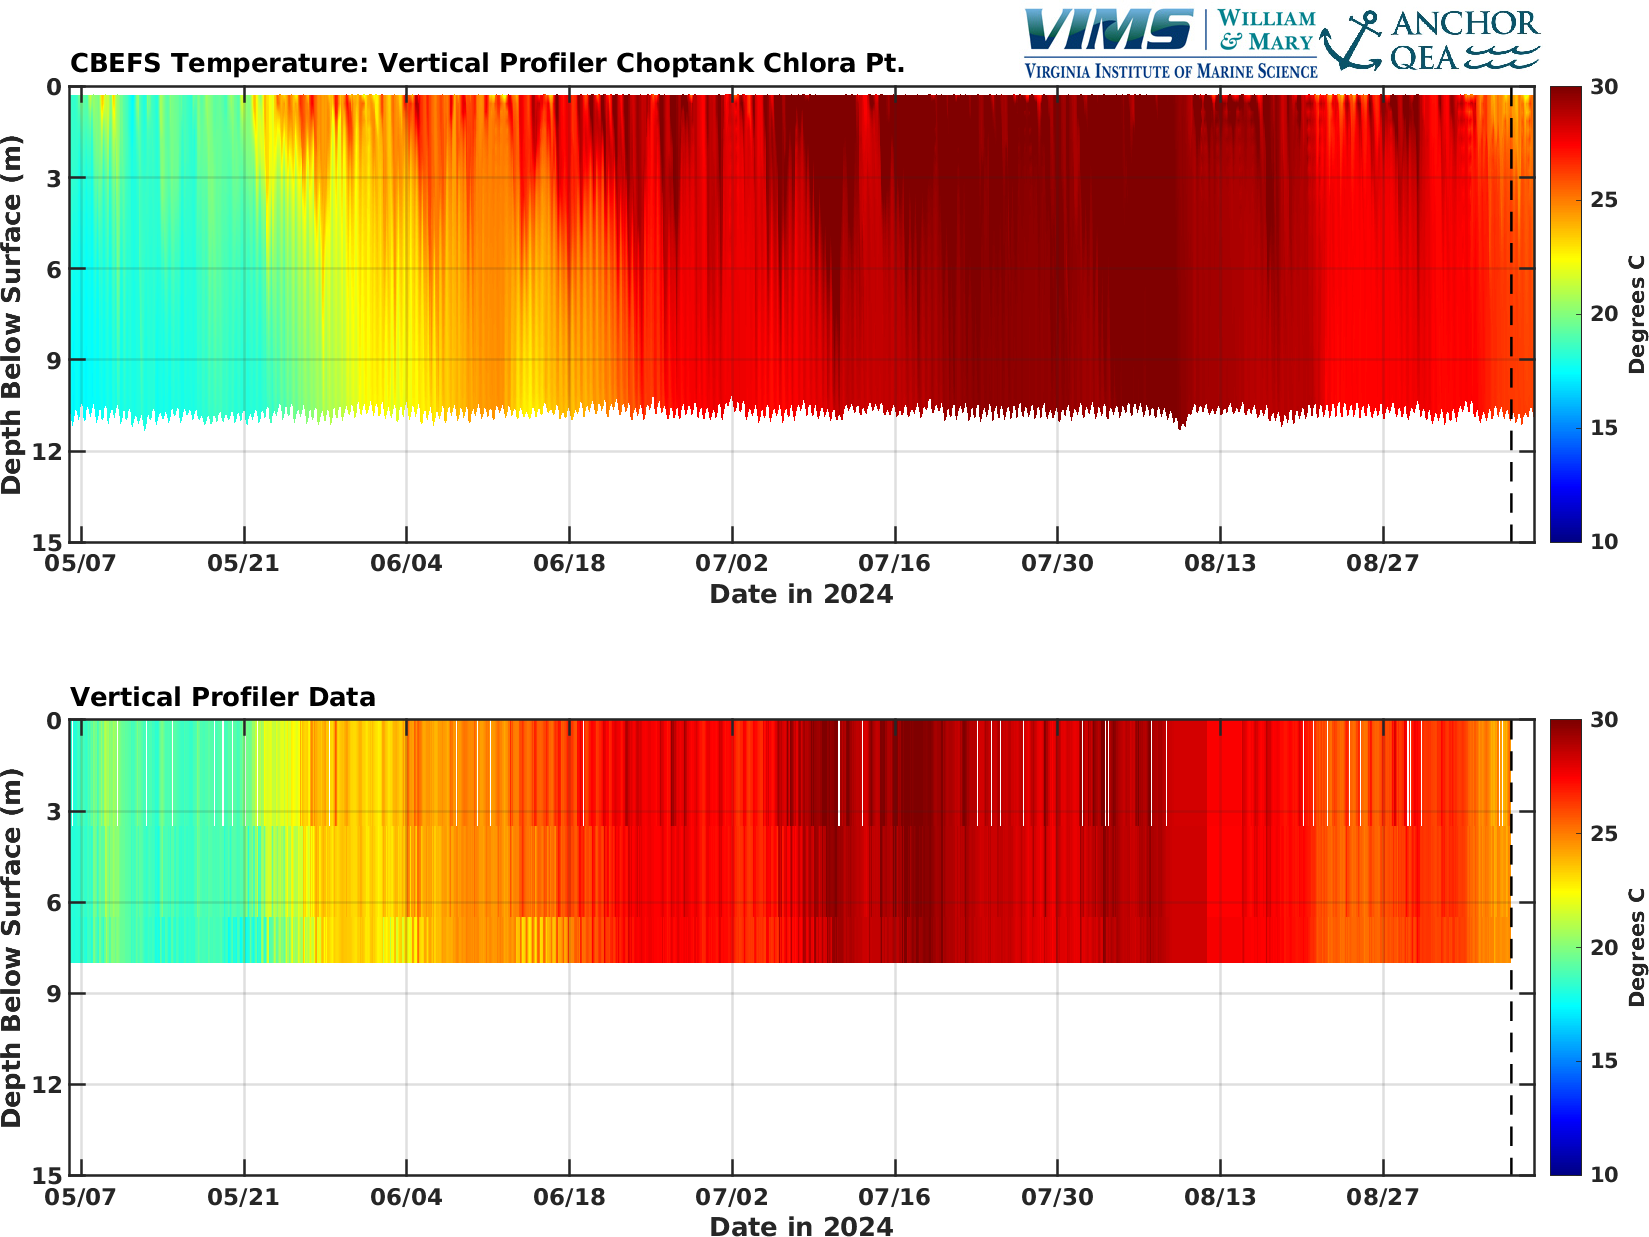
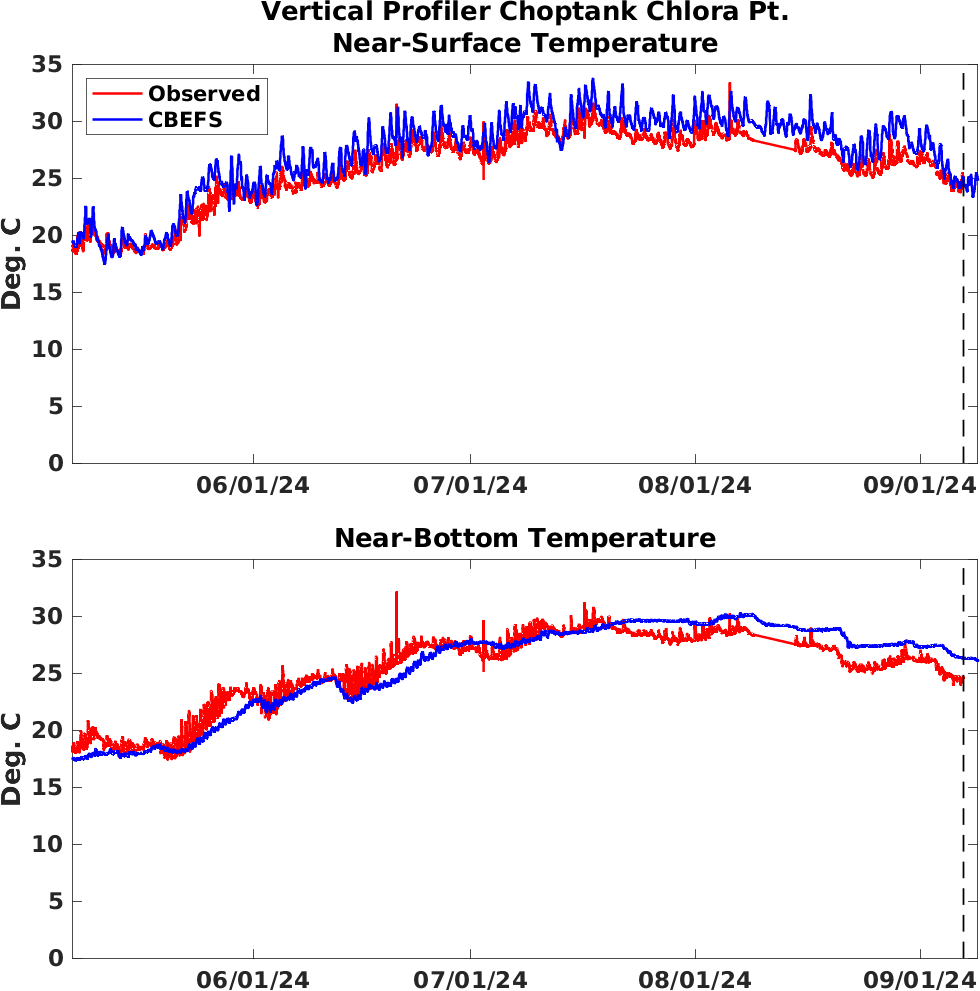
Vertical Profile Comparisons: Water TemperatureThis section compares modeled and observed conditions throughout the water column from near the water surface to near the sediment bed. NOAA has installed vertical arrays of sensors at six locations in the Bay to observe dissolved oxygen, salinity, and water temperature at a higher frequency than is available through the long-term Water Quality Monitoring Program data. These high-frequency data at multiple depths allow for the comparison of CBEFS model results to a relatively new type of data set; specifically allowing for the validation of tidal, daily, and weekly variation in the modeled environmental conditions. CBEFS is compared to the data using 2D plots showing time and depth and line plots showing the near-surface and near-bottom values.
----------------------------------------------------------------------------------------------------------------------
----------------------------------------------------------------------------------------------------------------------
----------------------------------------------------------------------------------------------------------------------
----------------------------------------------------------------------------------------------------------------------
----------------------------------------------------------------------------------------------------------------------
|
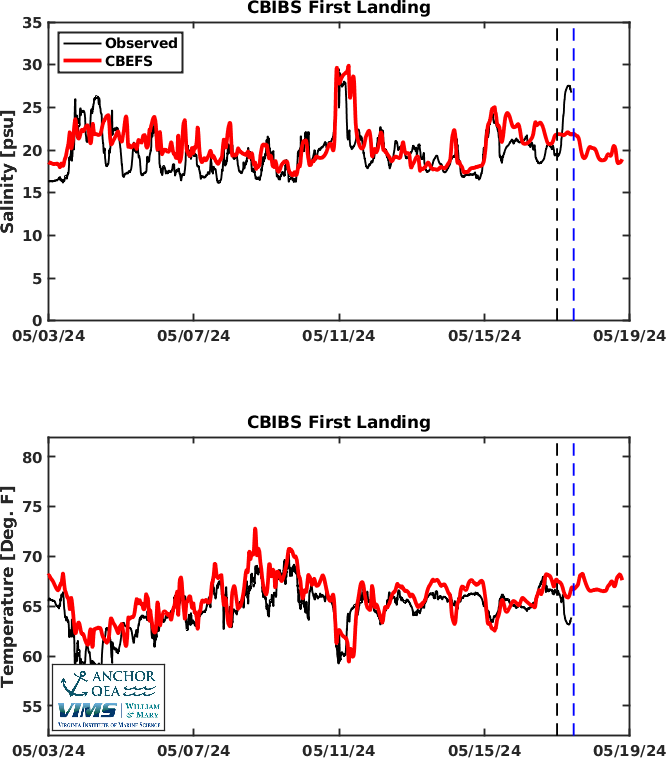
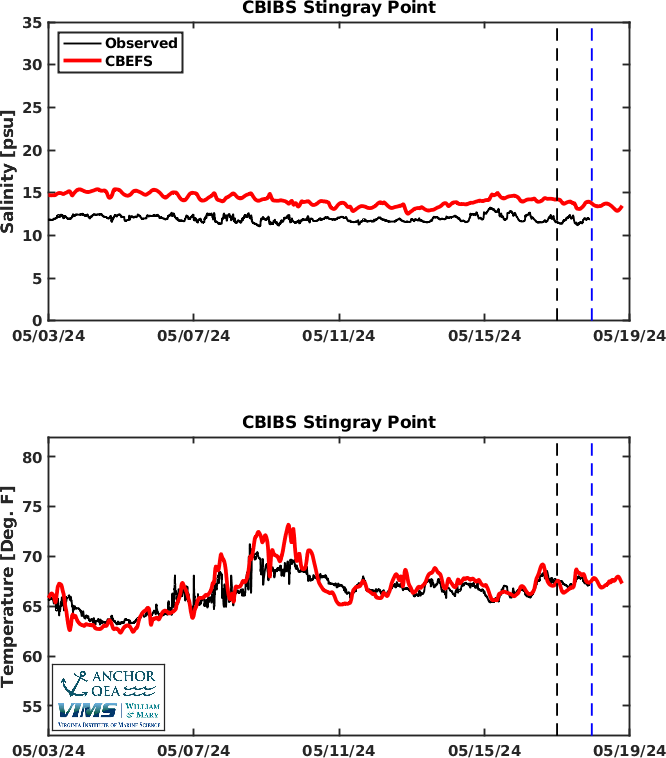
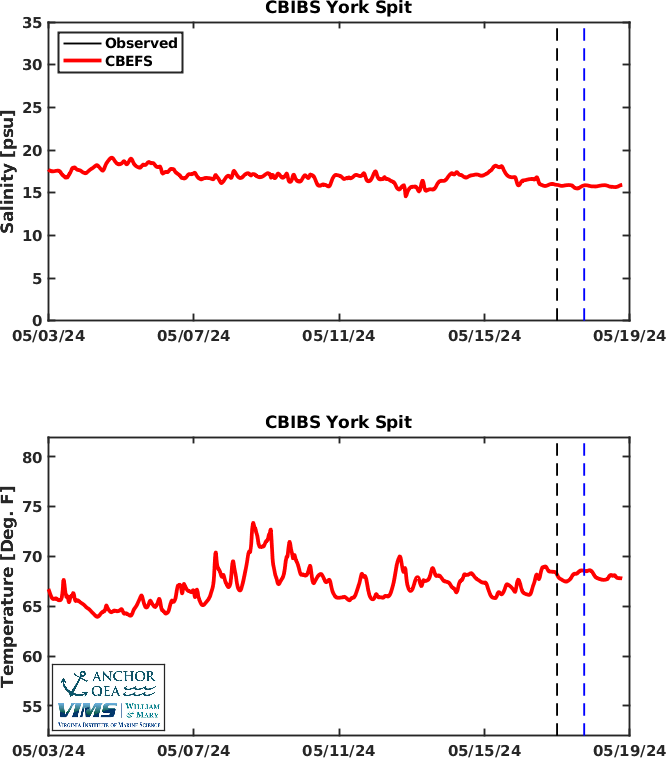
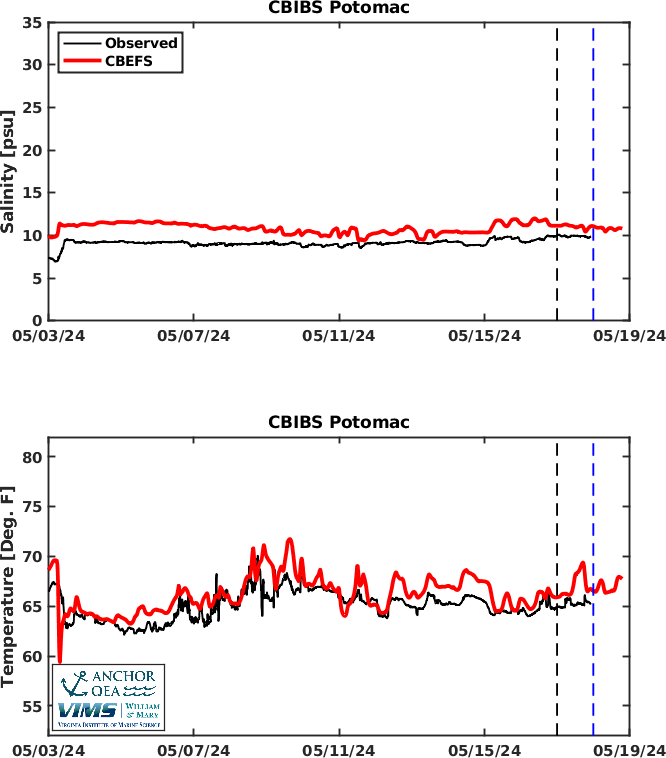
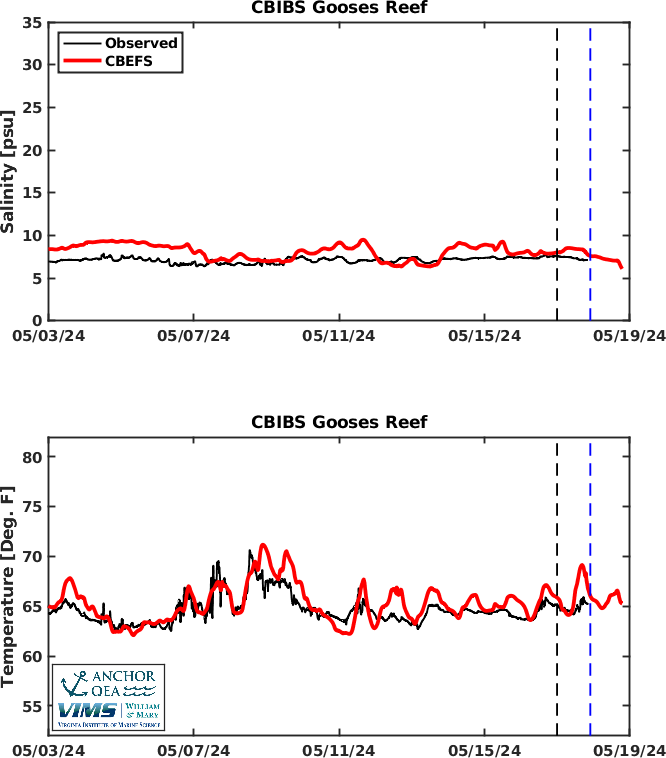
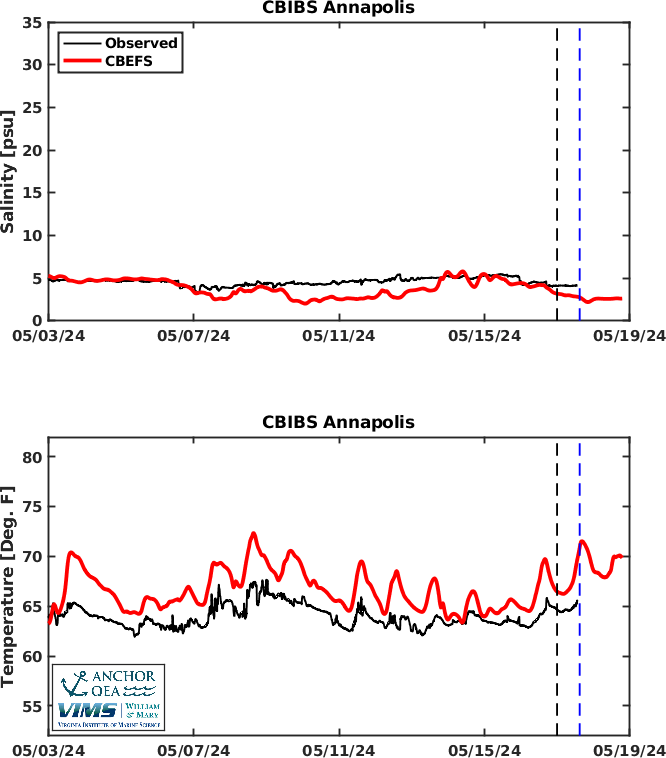
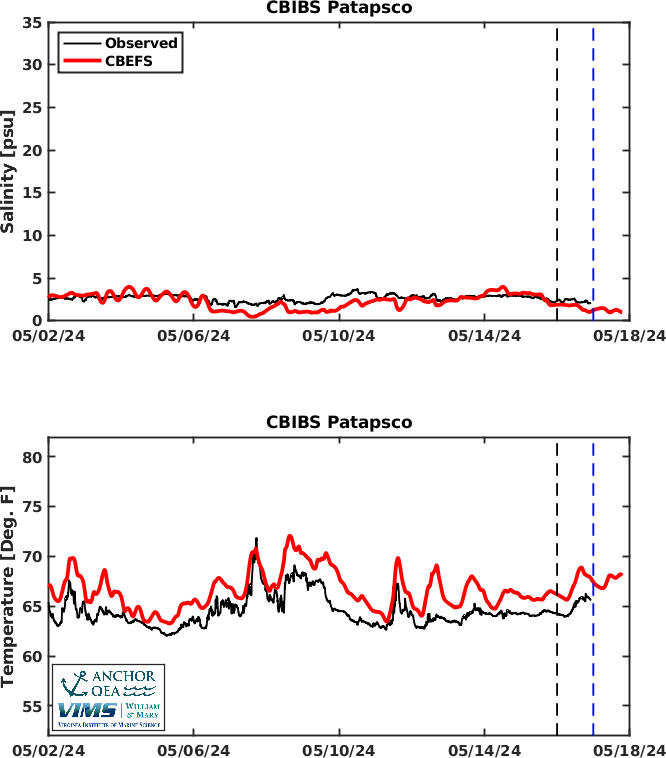
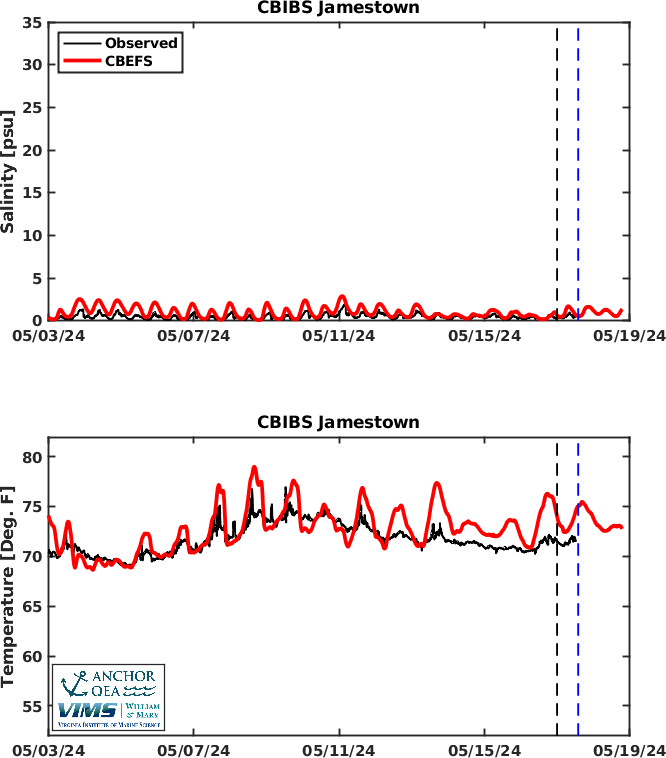
Line Plots of Salinity and Temperature (CBIBS, Near Surface)These images show the CBEFS (red) and the observed (black) salinity and temperature over the last 14 days and for the 2-day forecast. Midnight last night (today) is marked with a dashed vertical black line; the dashed blue line moves throughout the day marking the time of day to the latest hour. These images are used to visually determine how well the CBEFS values and the timing of increases or decreases matches the observed values.
----------------------------------------------------------------------------
----------------------------------------------------------------------------
----------------------------------------------------------------------------
----------------------------------------------------------------------------
----------------------------------------------------------------------------
----------------------------------------------------------------------------
----------------------------------------------------------------------------
---------------------------------------------------------------------------- |
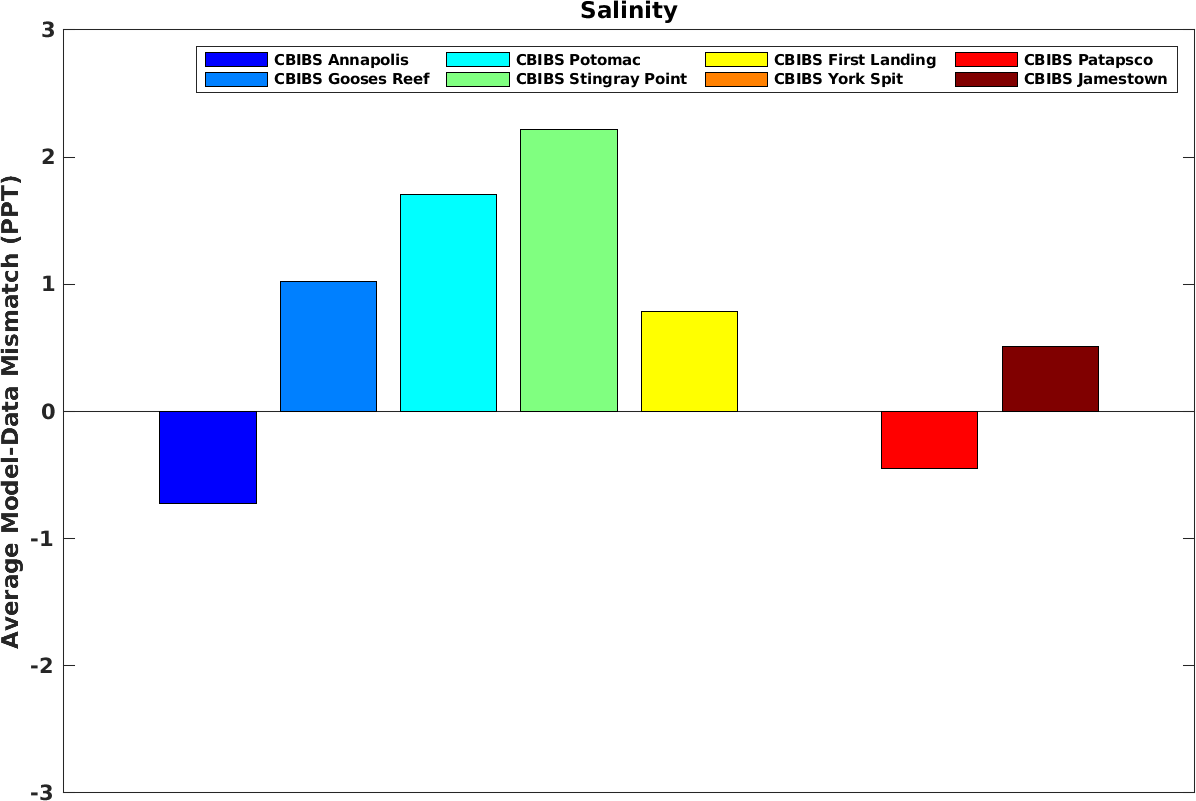
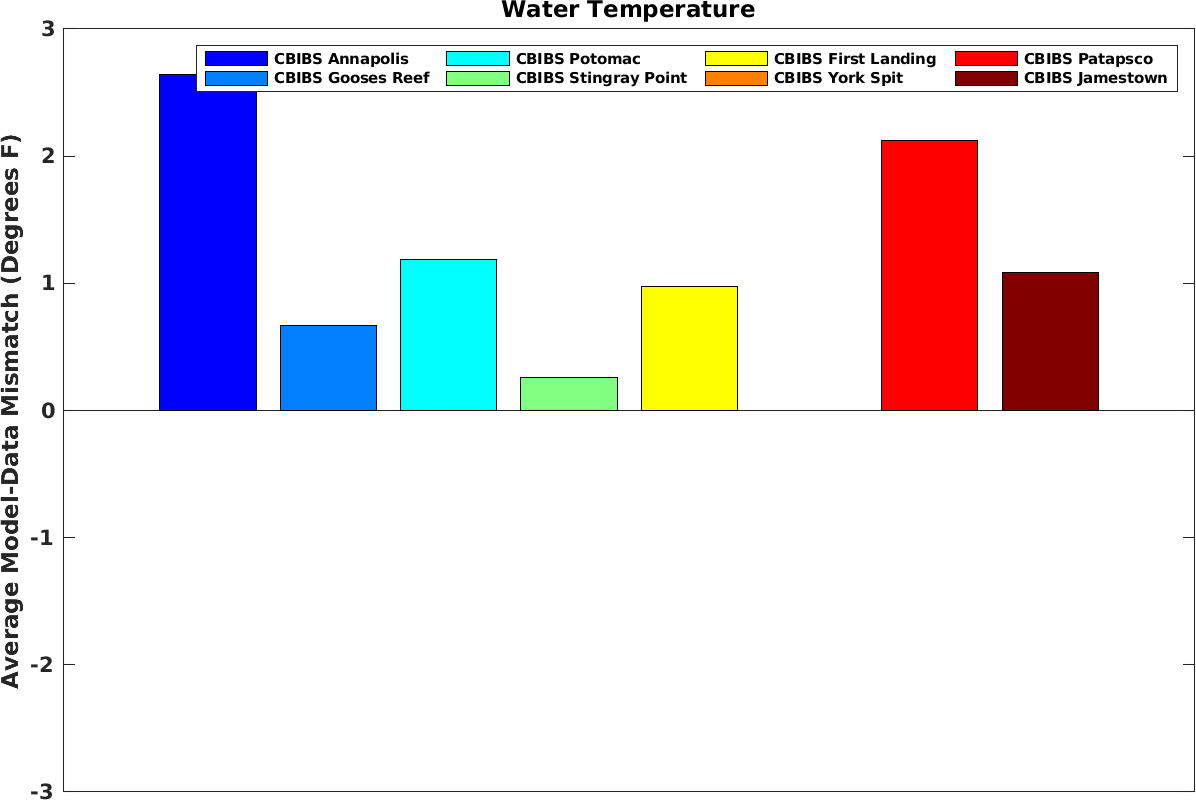
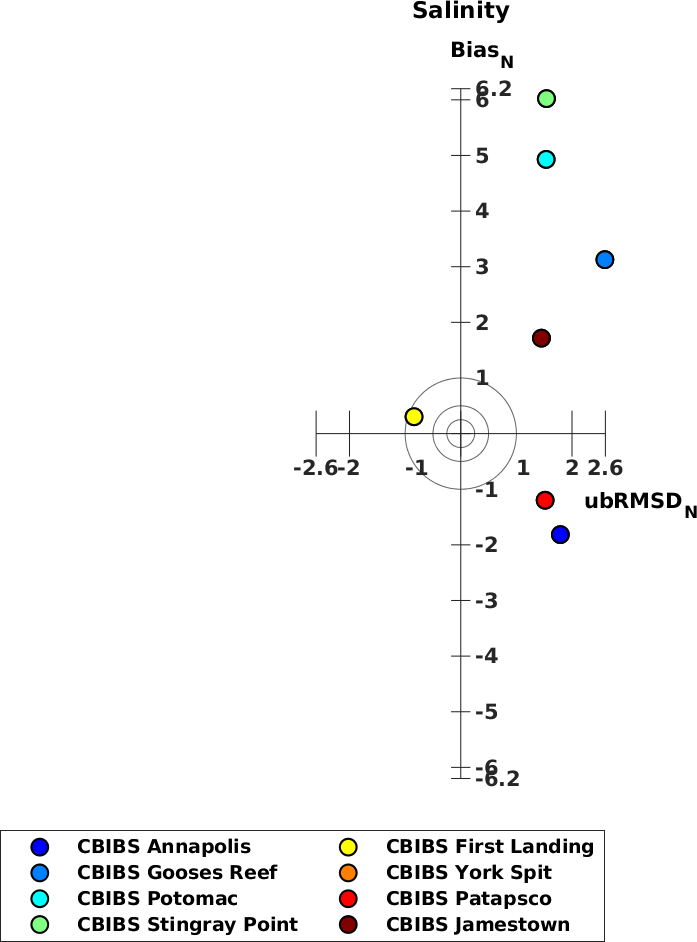
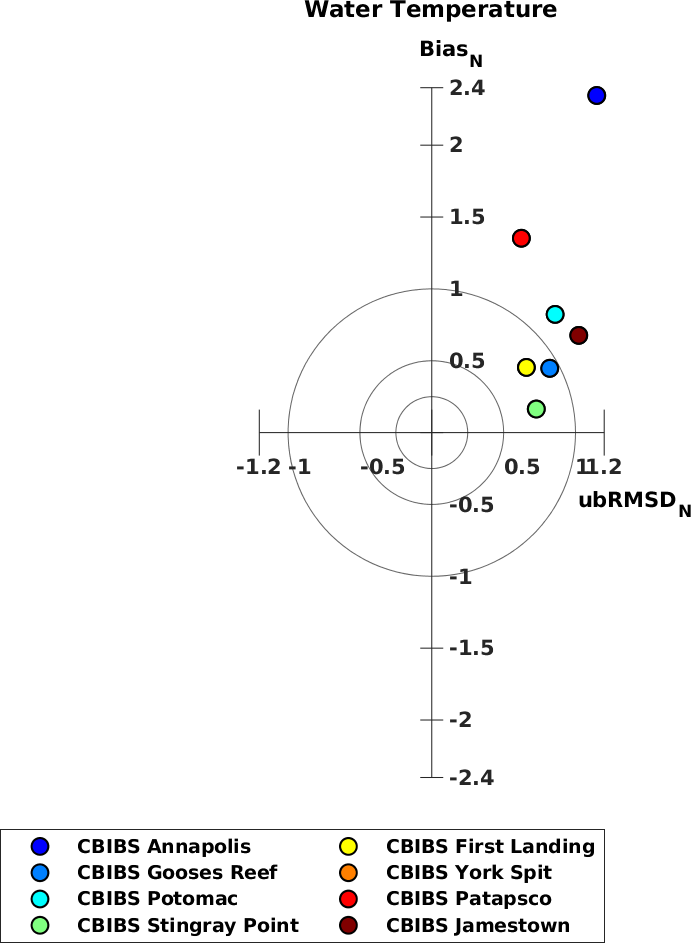
Average CBEFS Salinity and Temperature Accuracy (CBIBS, Near Surface)The first images provides the average difference between the CBEFS salinity and water temperature and the observed values at each location. The average difference is calculated over the last 12 days. These images are used to determine, on average, how well the CBEFS values matched the observed values. This final images are called "target diagrams" and statistically compare the CBEFS and observed values. The closer to the center of the bullseye the more accurate the CBEFS values were. Points plotting above the zero value (above the bullseye) show that the CBEFS values were on average larger than observed, below the bullseye shows the CBEFS values were on average smaller than observed. Points plotting to the left of the bullseye show the variability through time in the CBEFS values was less than observed, and to the right of the bullseye show the variability through time in the CBEFS values was more than observed.
|
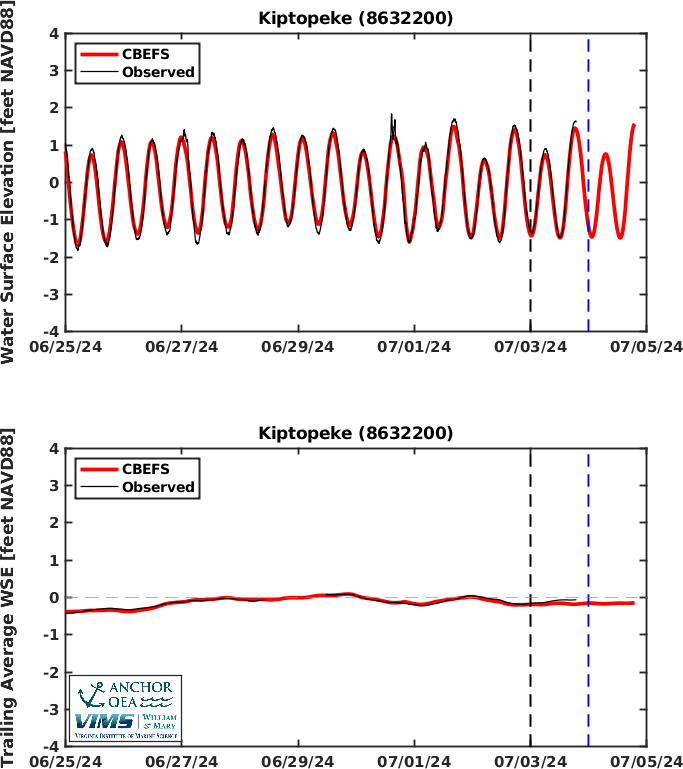
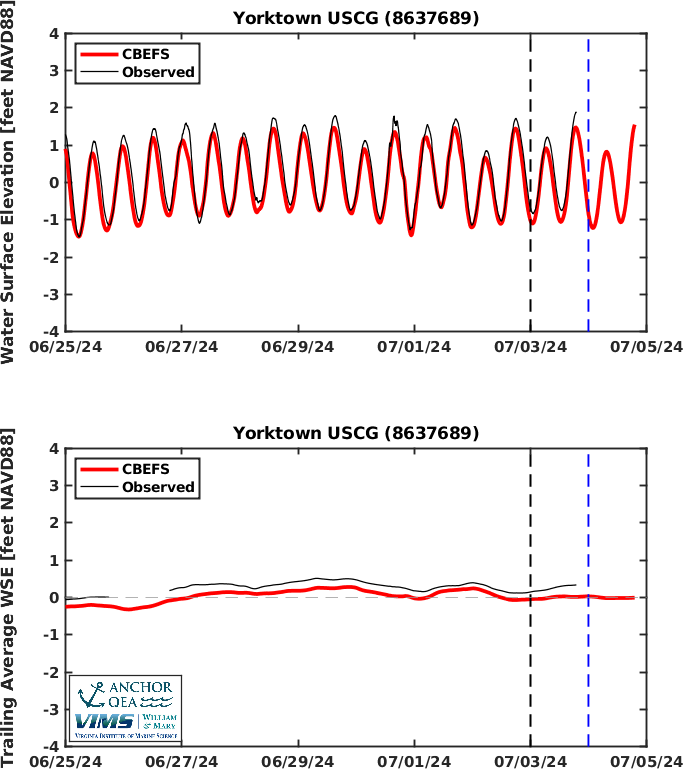
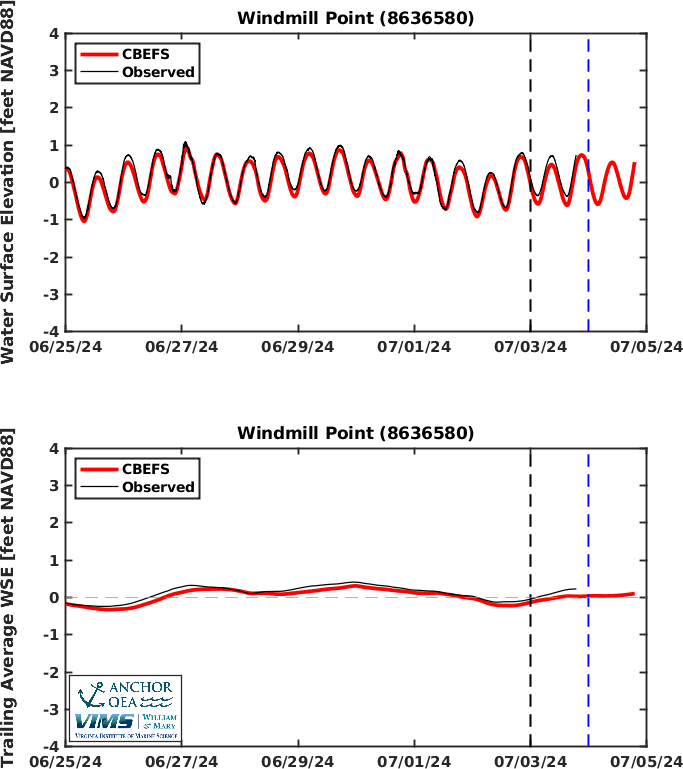
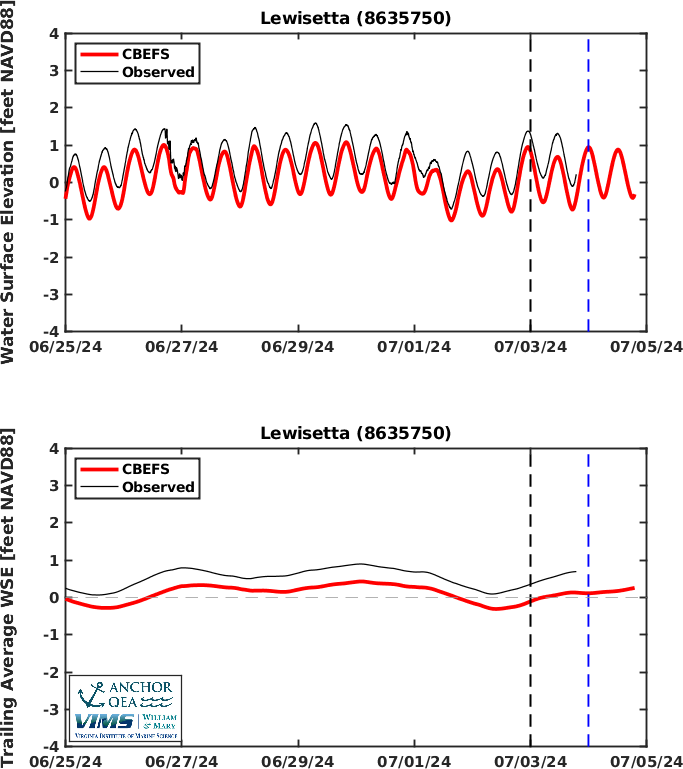
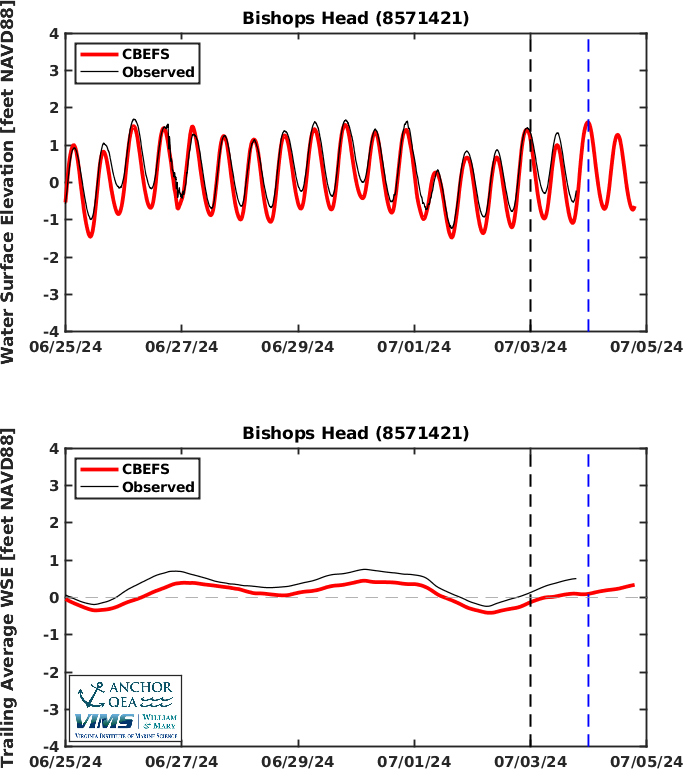
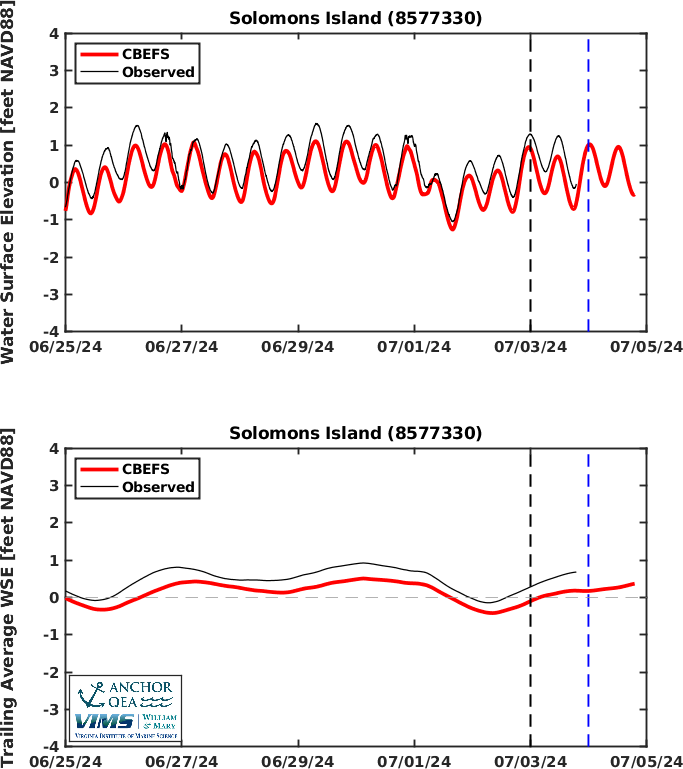
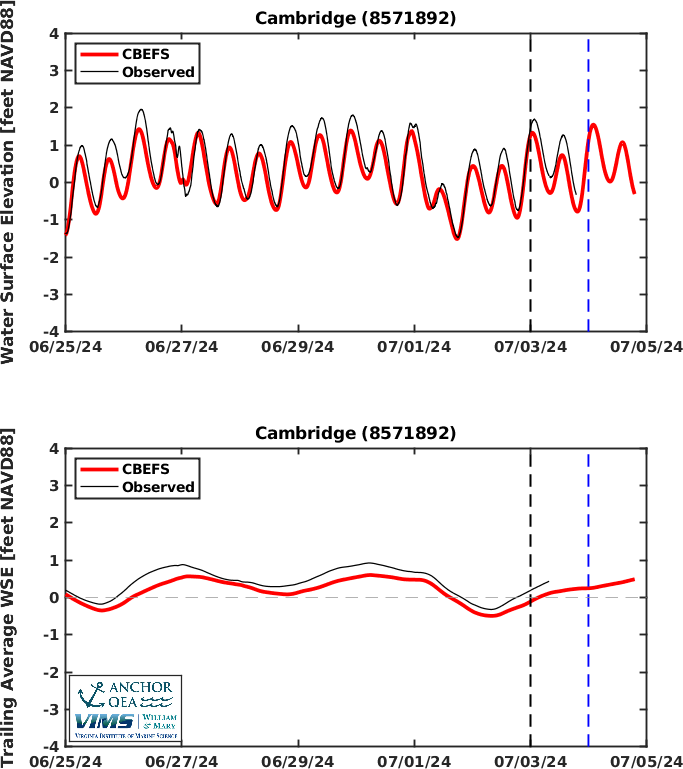
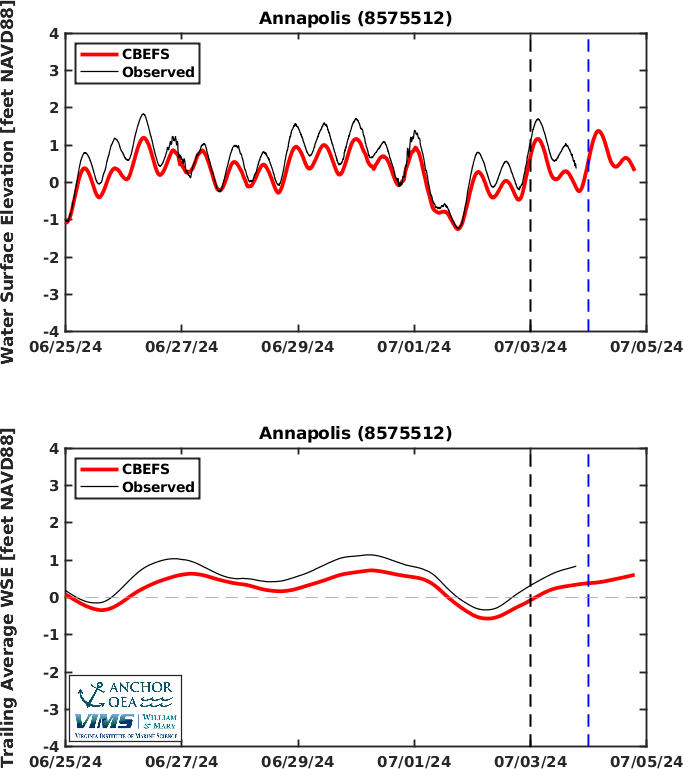
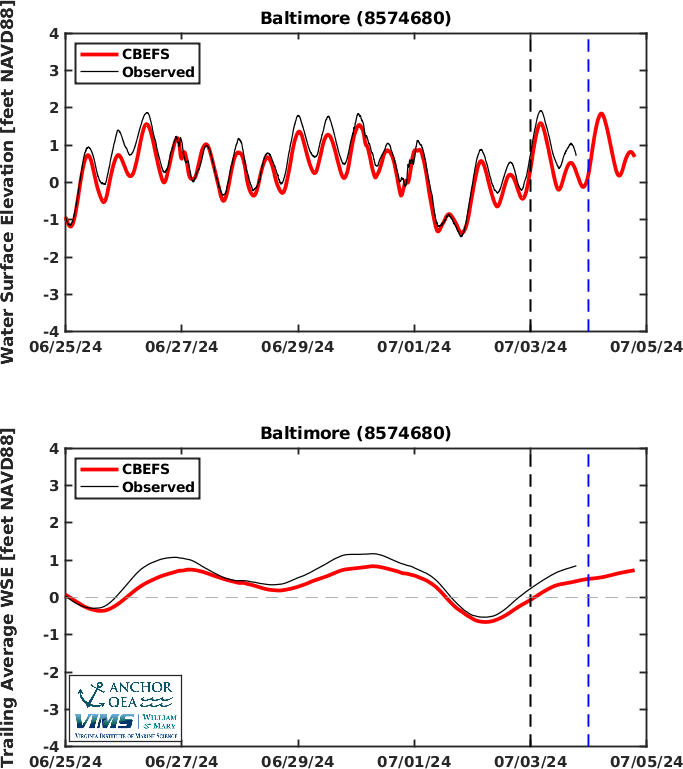
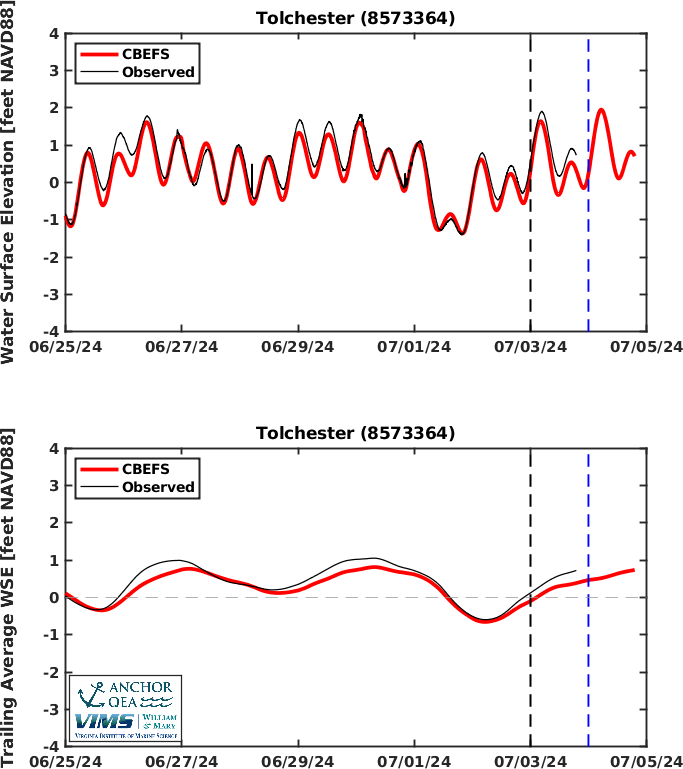
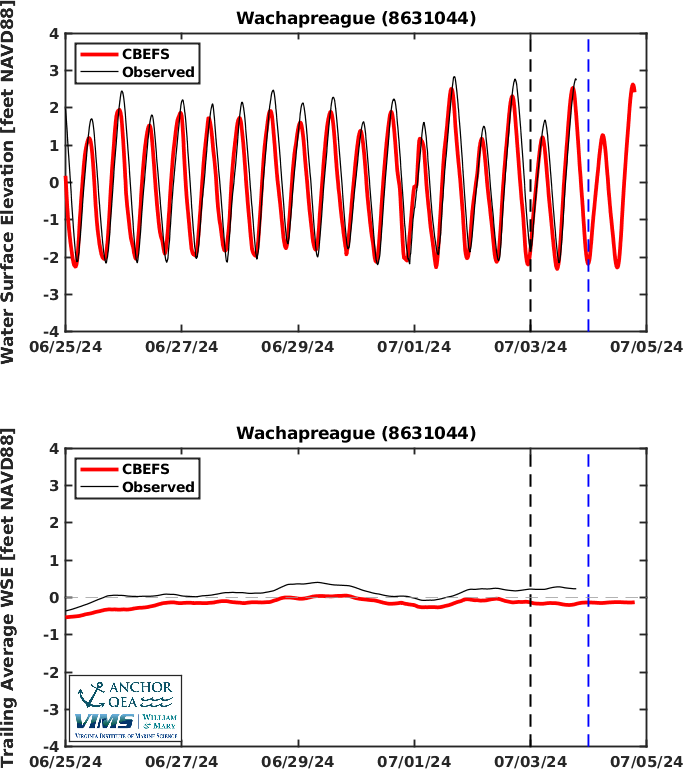
Line Plots of Water Level (Water Surface Elevation)These images show the CBEFS (red) and the observed (black) water level over the last 8 days and for the 2-day forecast. Midnight last night (today) is marked with a dashed vertical black line; the dashed blue line moves throughout the day marking the time of day to the latest hour. The changes in water level through time are caused by tides propagating into the Bay from the Atlantic Ocean, storm surge from the ocean, and winds. These images are used to visually determine how well the CBEFS values and the timing of increases or decreases matches the observed values.
-------------------------------------------------------------------------------------------
-------------------------------------------------------------------------------------------
-------------------------------------------------------------------------------------------
-------------------------------------------------------------------------------------------
-------------------------------------------------------------------------------------------
-------------------------------------------------------------------------------------------
-------------------------------------------------------------------------------------------
-------------------------------------------------------------------------------------------
-------------------------------------------------------------------------------------------
-------------------------------------------------------------------------------------------
-------------------------------------------------------------------------------------------
|

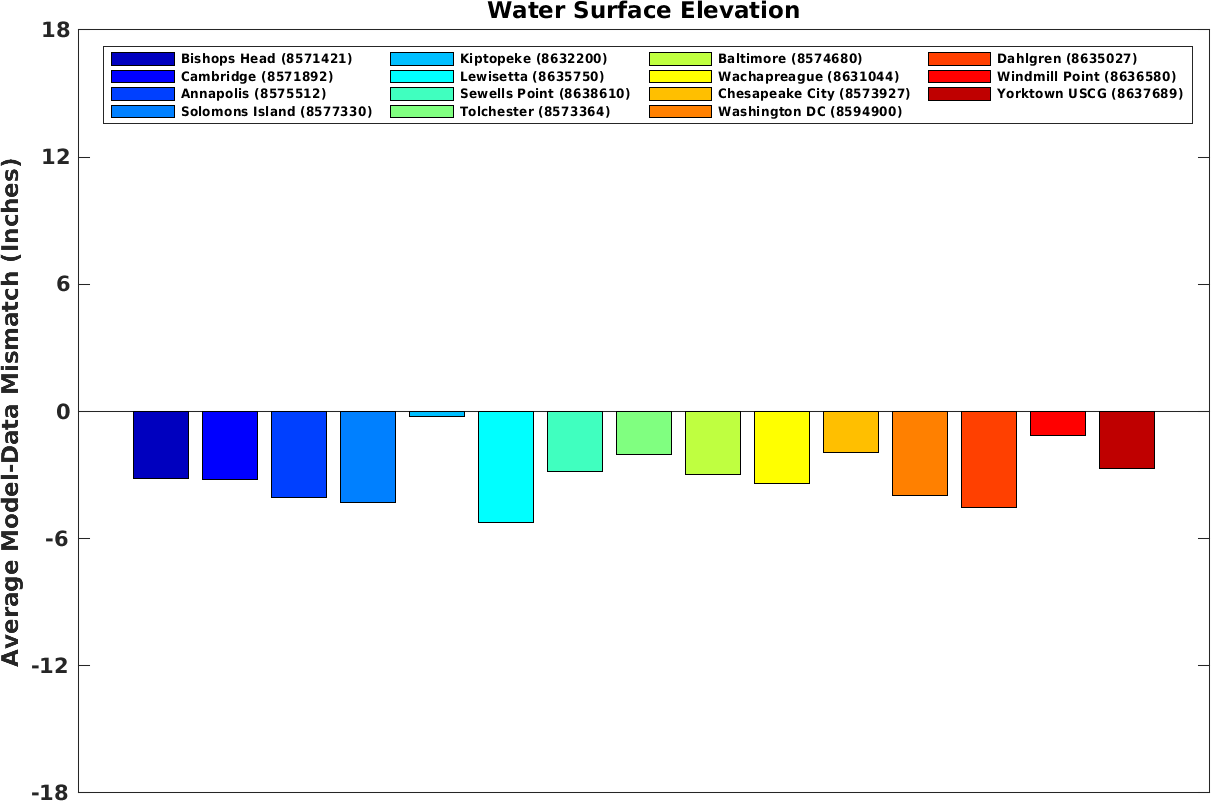
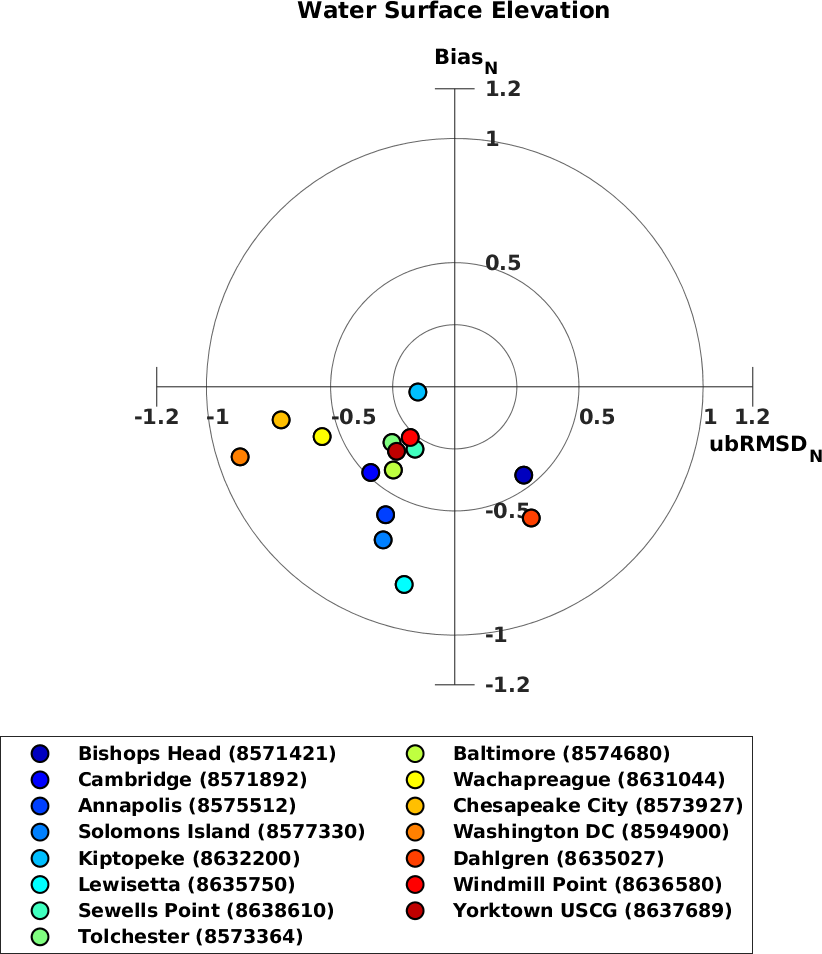
Average CBEFS Water Level AccuracyThe first image provides the average difference between the CBEFS water level and the observed values at each location. The average difference is calculated over the last 8 days. These images are used to determine, on average, how well the CBEFS values matched the observed values. The final image is called a "target diagram" and statistically compares the CBEFS and observed values. The closer to the center of the bullseye the more accurate the CBEFS values were. Points plotting above the zero value (above the bullseye) show that the CBEFS values were on average higher than observed, below the bullseye shows the CBEFS values were on average lower than observed. Points plotting to the left of the bullseye show the variability through time in the CBEFS values was less than observed, and to the right of the bullseye show the variability through time in the CBEFS values was more than observed.
|